
累积频数曲线
几何画板及绘图内容加载中,请稍等……
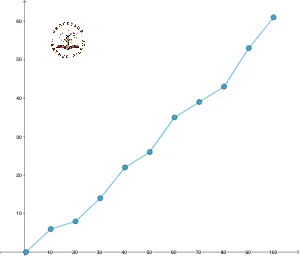
这个范例演示了累积频数曲线的绘制方法。它涉及频率分布、统计学等核心数学概念。通过使用GeoGebra命令如Segment、Textfield、If等,可以构造累积频数曲线。适合高中及以上学生学习和使用。
GeoGebra 命令及参数
Segment(A, B) → fSegment(C, D) → gTextfield(ll1) → InputBox1Textfield(ul1) → InputBox11Textfield(f1) → InputBox21Textfield(f2) → InputBox22Textfield(f3) → InputBox23Textfield(f4) → InputBox24Textfield(f5) → InputBox25Textfield(f6) → InputBox26Textfield(f7) → InputBox27Textfield(f8) → InputBox28Textfield(f9) → InputBox29Textfield(f10) → InputBox30If(classes ≟ 10, f1 + f2 + f3 + f4 + f5 + f6 + f7 + f8 + f9 + f10 + 2, classes ≟ 5, f1 + f2 + f3 + f4 + f5 + 2, classes ≟ 9, f1 + f2 + f3 + f4 + f5 + f6 + f7 + f8 + f9 + 2, classes ≟ 8, f1 + f2 + f3 + f4 + f5 + f6 + f7 + f8 + 2, classes ≟ 7, f1 + f2 + f3 + f4 + f5 + f6 + f7 + 2, classes ≟ 6, f1 + f2 + f3 + f4 + f5 + f6 + 2) → maxSegment(E, F) → hSegment(F, G) → iSegment(G, H) → jSegment(H, I) → kSegment(I, J) → lSegment(J, K) → mSegment(K, L) → nSegment(L, M) → pSegment(M, N) → qSegment(N, O) → r