
平均数、中位数与众数的几何作图示例
几何画板及绘图内容加载中,请稍等……
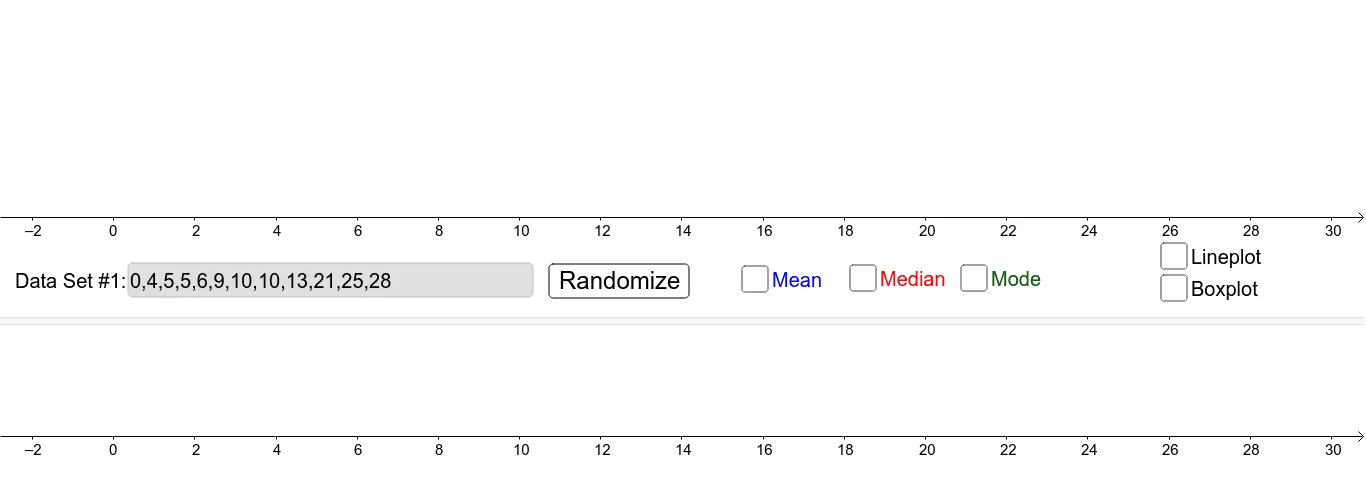
本范例通过GeoGebra演示平均数、中位数和众数的计算方法。核心数学概念包括统计学中的集中趋势度量、几何图形与数据分布的关系。作图要点包括使用Textfield、Remove、Flatten、Sequence、If、DotPlot、Zip、Line、Sort、UnicodeToText、BoxPlot等命令,以及ds1、ds2、plot1、plot2等对象。适合初中生学习统计基础,或高中生进行数据分析实践。
GeoGebra 命令及参数
Textfield(ds1Text) → InputBox1Remove(TextToUnicode[ds1Text], Sequence[32, i, 1, Length[TextToUnicode[ds1Text]]]) → unicode1Flatten(Join[{{{0}, Remove[Sequence[If[Element[unicode1, i] ≟ 44, i, 0], i, 1, Length[unicode1]], Sequence[0, i, 1, Length[unicode1]]]}, {Length[unicode1] + 1}}]) → locationOfCommas1Sequence(Take[unicode1, Element[locationOfCommas1, i] + 1, Element[locationOfCommas1, i + 1] - 1], i, 1, Length[locationOfCommas1] - 1) → removedCommas1Sequence(UnicodeToText[Element[removedCommas1, i]], i, 1, Length[removedCommas1]) → backToNumbers1If(Length[ds1Text] > 0, RemoveUndefined[Sort[Zip[FromBase[A, 10], A, backToNumbers1]]], {}) → ds1Textfield(ds2Text) → InputBox2Remove(TextToUnicode[ds2Text], Sequence[32, i, 1, Length[TextToUnicode[ds2Text]]]) → unicode2Flatten(Join[{{{0}, Remove[Sequence[If[Element[unicode2, i] ≟ 44, i, 0], i, 1, Length[unicode2]], Sequence[0, i, 1, Length[unicode2]]]}, {Length[unicode2] + 1}}]) → locationOfCommas2Sequence(Take[unicode2, Element[locationOfCommas2, i] + 1, Element[locationOfCommas2, i + 1] - 1], i, 1, Length[locationOfCommas2] - 1) → removedCommas2Sequence(UnicodeToText[Element[removedCommas2, i]], i, 1, Length[removedCommas2]) → backToNumbers2If(Length[ds2Text] > 0, RemoveUndefined[Sort[Zip[FromBase[A, 10], A, backToNumbers2]]], {}) → ds2DotPlot(ds1) → plot1DotPlot(ds2) → plot2If(Defined[Min[Join[{ds1, ds2}]]], Min[Join[{ds1, ds2}]], 0) → minIf(Defined[Max[Join[{ds1, ds2}]]], Max[Join[{ds1, ds2}]], 10) → maxIf(Defined[Max[{Max[Frequency[ds1]], Max[Frequency[ds2]], 3}]], Max[{Max[Frequency[ds1]], Max[Frequency[ds2]], 3}], 3) → heightZip(Line[(A, 0), x = 0], A, Mode[ds1]) → mode1Zip(Line[(A, 0), x = 0], A, Mode[ds2]) → mode2Line((mean[ds1], 0), x = 0) → mean1Line((mean[ds2], 0), x = 0) → mean2Line((Median[ds1], 0), x = 0) → med1Line((Median[ds2], 0), x = 0) → med2Sort(Sequence[Random[0, 30], i, 1, Random[8, 16]]) → random1Sort(Sequence[Random[0, 30], i, 1, Random[10, 20]]) → random2Flatten(Sequence[TextToUnicode[Text[Element[random1, i] + ","]], i, 1, Length[random1]]) → random1asTextUnicodeToText(First[random1asText, Length[random1asText] - 1]) → ds1RandomBoxPlot(height / 2, height / 5, ds1) → boxPlot1BoxPlot(height / 2, height / 5, ds2) → boxPlot2Flatten(Sequence[TextToUnicode[Text[Element[random2, i] + ","]], i, 1, Length[random2]]) → random2asTextUnicodeToText(First[random2asText, Length[random2asText] - 1]) → ds2Random