
散点图离群值识别
几何画板及绘图内容加载中,请稍等……
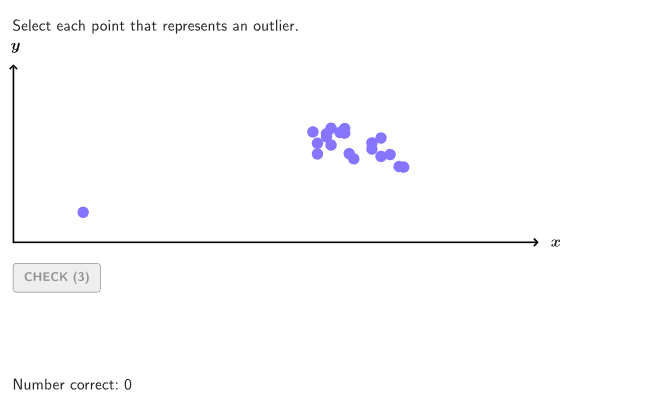
本范例演示如何在散点图中识别离群值。通过随机生成的双变量数据点,展示散点图的分布特征,帮助学生理解离群值(outlier)的概念及其对数据分析的影响。核心数学概念包括:双变量数据的散点图表示、离群值与聚类的识别、数据趋势分析。作图要点:利用RandomUniform命令生成随机坐标点,通过Sequence和Zip命令构建数据序列,用Polygon和Segment绘制图形元素,配合Text命令标注说明。适合6-8年级学生使用,可用于统计学入门教学,让学生掌握识别和分析数据中异常值的基本技能。
GeoGebra 命令及参数
RandomUniform(0, 0.99, 200) → allRandomSeeds, {0.7958563944291628, 0.3915624918818961, 0.2932294420836522, 0.7401431704012463, 0.5724260744306325, 0.4221525938901191, 0.34109160907200825, 0.1920062173159564, 0.06459378524871139, 0.6751254787774517, 0.32062091846183877, 0.5720348974994817, 0.22331925897635088, 0.096843629867881, 0.18811562796390063, 0.8203698204783221, 0.6687153478476997, 0.08261124973631181, 0.858568555031248, 0.20178749931964832, 0.874767751975692, 0.3752216590567491, 0.6502463678419537, 0.07006907993764211, 0.8881350399719284, 0.6877211873958065, 0.7660107840972353, 0.8597247594222645, 0.48882052213645943, 0.9845847202995538, 0.43172701145374964, 0.7749081018924836, 0.03272417760878359, 0.26326178391670785, 0.07228980774550432, 0.03983799795433378, 0.43173726117095146, 0.6167533302978182, 0.6344213618534845, 0.6154653387901594, 0.6561336846816218, 0.6275180858869077, 0.7324549204805334, 0.6234792288537817, 0.766542110089728, 0.823583044270964, 0.20881648558938223, 0.501042060352078, 0.1687490173529191, 0.4692472069838345, 0.15485300822112405, 0.7778757146537608, 0.8639873850970144, 0.7352180231402488, 0.8700271087595832, 0.10149074071876378, 0.7802076461902923, 0.7464089528112822, 0.05831069845703875, 0.7064577245020829, 0.7261068710146533, 0.9199531034376868, 0.5998565154992634, 0.8896653388235399, 0.6194083045386612, 0.5112508125444578, 0.0037127433237835526, 0.20549177676785033, 0.6440387996790884, 0.30207108796431986, 0.6434688791755673, 0.6727357478348958, 0.40744229203677385, 0.861864575705091, 0.6322816045965117, 0.829011828321198, 0.029297719810629987, 0.0015228640392135962, 0.6667271636389044, 0.4681084424090525, 0.9063759752366872, 0.3178316442985397, 0.3103627117189817, 0.9715401976612131, 0.4651751323890168, 0.4868172665175646, 0.5477518272262617, 0.27719584300321637, 0.27431458986255963, 0.8050742765065133, 0.8080200889537797, 0.1455905880889658, 0.4524487545051796, 0.4599880047523782, 0.7937546807712456, 0.15777624158916556, 0.7046767743342622, 0.12252997231276885, 0.2662472579581525, 0.2684455660584788, 0.26107990954340693, 0.20000478458426962, 0.7517028741538923, 0.4731865646071906, 0.3151096071688003, 0.47076617087072503, 0.4650977504439952, 0.9302003076969629, 0.897078545236155, 0.45849583389272625, 0.9588672224995374, 0.3940903854577935, 0.9489738507998193, 0.5001523888535302, 0.21254021836316322, 0.7125651825333108, 0.25121610767710517, 0.12914905868235727, 0.3868102079874485, 0.9060630714392015, 0.42982910804351204, 0.9537071392452489, 0.3813427049349712, 0.04541912757159863, 0.6337654114070467, 0.119658898092048, 0.369867698728792, 0.013736307778379982, 0.4268484536057839, 0.7672366049161309, 0.828790746785832, 0.3456060488252243, 0.5669475049998695, 0.3125862159416647, 0.526679639537814, 0.7497445253821092, 0.9465924165087093, 0.3368824433210023, 0.37154408442406855, 0.3699664321067477, 0.38426515170810605, 0.5089982898281532, 0.9408238814490792, 0.37421483323730037, 0.23407182419861483, 0.20169585156131414, 0.3454365259265787, 0.8620964665737362, 0.9434025041590448, 0.6562561985053055, 0.36410830891567497, 0.6780431959932847, 0.30352933258129783, 0.4663550099872679, 0.6475237779407599, 0.1098266489195119, 0.7468708655756197, 0.8588166464308096, 0.2535756306952432, 0.3506986715614222, 0.7468692928921373, 0.5966431442216774, 0.175183988032395, 0.8979123118545231, 0.9720799911198285, 0.9284155925995324, 0.940775587674635, 0.910798117341396, 0.34516547722753954, 0.4578044491752583, 0.9545753182858937, 0.08792799313471682, 0.440014843961109, 0.4675007741791743, 0.23935939358061237, 0.5251934528243069, 0.5161766455688401, 0.7433950042938801, 0.6482558916496483, 0.6148580961587056, 0.419197340804247, 0.7272802044003266, 0.0945510069298192, 0.7798135700107173, 0.9182994835011812, 0.19974578346205316, 0.9492699809923367, 0.79737581002263, 0.7991128170773751, 0.8192540671404379, 0.3955497920028327, 0.23300344408647305, 0.54888848777437, 0.16865511746150427, 0.21650598151695236, 0.25630259990909265, 0.10478084240361232, 0.9065971245340948, 0.8994195876317771, 0.30960207110173954}If(maxRandIndex > numRandoms, Take[allRandomSeeds, maxRandIndex - numRandoms, maxRandIndex], Take[allRandomSeeds, 1, numRandoms]) → currentRandomSeedsIf(regSlope < 0, 8.5, If[regSlope > 0, 1.5, 2]) → regInterceptInsert((0.5 * 20 / divisorY), Sequence[floor(((currentRandomSeeds(numPoints - numOutliers + 1 + k) - 0.5) * 20)) / divisorY, k, 1, numPoints - 1], 10) → randomListYKeepIf(x > 0, randomListY) → posYIndexOf((0.5 * 20 / divisorY), randomListY) → onboardingIndexIf(currentRandomSeeds(1) > 0.5, true, false) → isClusterIf(isCluster, round((currentRandomSeeds(1) * 7) + 1), 5) → clusterLocationIf(isCluster, 11, 3) → divisorXIf(isCluster, Sequence[clusterLocation + round(((currentRandomSeeds(k + 1) - 0.5) * 25)) / divisorX, k, 1, numPoints], Sequence[((k + ((-1)^(k + 1) * currentRandomSeeds(k + 1))) * (maxX - 1) / numPoints), k, 1, numPoints]) → randomListXSequence((Element[randomListX, k], (regSlope * Element[randomListX, k]) + regIntercept + Element[randomListY, k]), k, 1, numPoints) → pointsListIf(abs(abs(regSlope) - 0.5) ≤ 0.1, (regSlope * (-1 / 2)), If[regSlope ≠ 0, (regSlope * (-1)), 0.3]) → outlierSlopeSequence(currentRandomSeeds(k) / 2 + k, k, 1, 9) → outlierX, {1.3979281972145814, 2.1957812459409483, 3.1466147210418263, 4.370071585200623, 5.286213037215316, 6.21107629694506, 7.170545804536004, 8.096003108657978, 9.032296892624355}Zip((k, (outlierSlope * k) + outlierIntercept), k, outlierX) → outlierOptionsKeepIf(Distance[A, ClosestPoint[pointsList, A]] > outlierMin, A, outlierOptions) → outlierPointsElement(outlierPoints, Length[outlierPoints]) → Outlier2Element(outlierPoints, 1) → Outlier1Element({{Outlier1}, {Outlier1, Outlier2}}, numOutliers) → allOutliersJoin({pointsList, allOutliers}) → allPointsTake(inputCurrent, 1, numPoints) → clusterBooleanListTake(inputCurrent, numPoints + 1, numPoints + numOutliers) → outlierBooleanListCorner(5) → layoutAppSizePolygon({(-0.5, -0.5), (-0.5, maxY + 0.5), (maxX + 0.5, maxY + 0.5), (maxX + 0.5, -0.5)}) → viewboxElement(pointsList, 1) → point1Element(pointsList, 2) → point2Element(pointsList, 3) → point3Element(pointsList, 4) → point4Element(pointsList, 5) → point5Element(pointsList, 6) → point6Element(pointsList, 7) → point7Element(pointsList, 8) → point8Element(pointsList, 9) → point9Element(pointsList, 10) → point10Element(pointsList, 11) → point11Element(pointsList, 12) → point12Element(pointsList, 13) → point13Element(pointsList, 14) → point14Element(pointsList, 15) → point15Element(pointsList, 16) → point16Element(pointsList, 18) → point18Element(pointsList, 19) → point19Element(pointsList, 17) → point17Segment((0, 0), (0, maxY + 0.5)) → yAxisLineSegment((0, 0), (maxX + 0.5, 0)) → xAxisLineText("y", (0.05, maxY + 0.6), true, true, 0, 1) → lblYPolygon({(-0.5, -0.5), (-0.5, maxY), (maxX, maxY), (maxX, -0.5)}) → ShadedBoxRemoveUndefined(Sequence[If[clusterBooleanList(A), allPoints(A)], A, 1, numPoints]) → selectedClusterPointsRemoveUndefined(Sequence[If[outlierBooleanList(A), allOutliers(A)], A, 1, numOutliers]) → selectedOutliersJoin({selectedClusterPoints, selectedOutliers}) → allSelectedPointsText("x", (maxX + 0.6, 0.1), true, true, 1, 0) → lblX
AI 绘图提示语参考
绘制一个散点图,包含随机生成的数据点以及可能出现的异常值点。图形应有坐标轴和网格线以辅助观察。构造顺序为:先生成随机坐标点,识别偏离整体趋势的异常值点,最后将所有点绘制在坐标系中,并用不同标记区分异常值。
以上提示语为根据原始绘图命令整理而来,仅供参考。