
参数方程绘图 by Brian Sterr
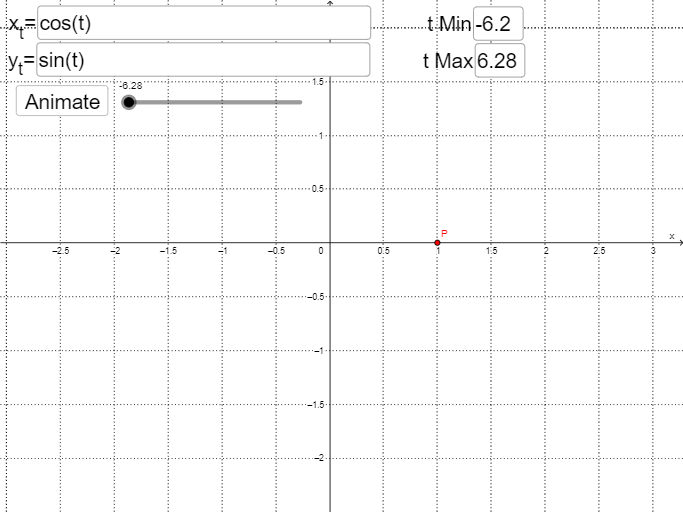
几何画板及绘图内容加载中,请稍等……
①本范例演示如何通过参数方程绘制二维曲线图形;②涉及核心数学概念包括参数方程、解析几何、函数图像;③作图要点:使用了Textfield、Curve、Sequence、Segment等GeoGebra命令和对象来构建参数方程的图形;④适合高中数学教学和学生学习参数方程的应用。
GeoGebra 命令及参数
Textfield(f) → inputBox1Textfield(g) → inputBox2CurveCartesian(f(t), g(t), t, tMin, tMax) → bCurveCartesian(f(t), g(t), t, tMin, a) → eTextfield(tMin) → inputBox3Textfield(tMax) → inputBox4Sequence(tMin + (tMax - tMin) / 10 + ((k * (tMax - tMin))) / 5, k, 0, 4) → l1, {-5.0236814692820415, -2.511044407846124, 0.0015926535897934357, 2.514229715025711, 5.026866776461628}Segment(e(l1(2)), e(l1(2) + 0.0001)) → iSegment(e(l1(1)), e(l1(1) + 0.0001)) → hSegment(e(l1(3)), e(l1(3) + 0.0001)) → jSegment(e(l1(4)), e(l1(4) + 0.0001)) → kSegment(e(l1(5)), e(l1(5) + 0.0001)) → l