
绘制线性方程:斜率与截距互动练习 by Tim Brzezinski
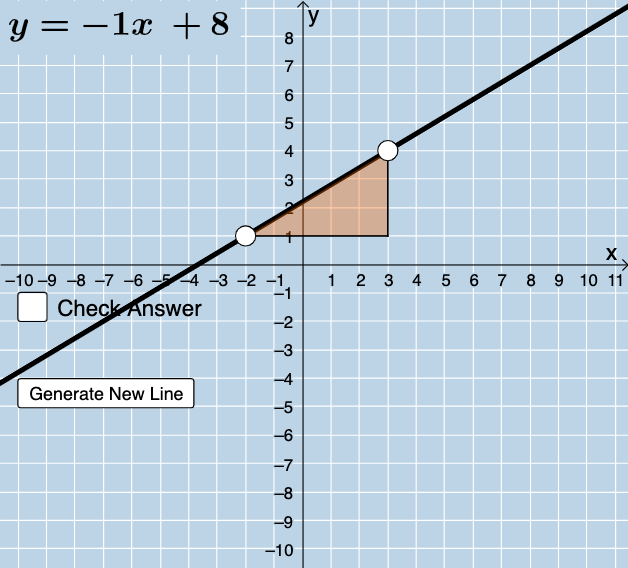
几何画板及绘图内容加载中,请稍等……
所属专题
A1.ACE.1 - Create and solve equations and inequalities
Graphing Linear Equations
Graphing Linear Equations
Graphing Linear Equations
Graphing Linear Equations
Graphing Linear Equations: Formative Assessment Items
Graphing Linear Equations: Formative Assessment Items
Graphing Linear Equations: Formative Assessment Items
这是一个用于绘制线性方程的互动练习,通过斜率和截距提供即时反馈。它使用了GeoGebra中的Line, FractionText, Intersect, Polygon, Segment等命令,帮助学生理解线性方程的图形表示。适合初中及以上学生使用。
GeoGebra 命令及参数
Sequence(i, i, -10, -1) → a, {-10, -9, -8, -7, -6, -5, -4, -3, -2, -1}Sequence(i, i, -10, -1) → b, {-10, -9, -8, -7, -6, -5, -4, -3, -2, -1}Sequence(i, i, 1, 10) → c, {1, 2, 3, 4, 5, 6, 7, 8, 9, 10}Union(b, c) → dRandom(-12, 12) → eLine(A, B) → gFractionText(Slope[f]) → text1FractionText(f(0)) → text2Intersect(p, eq1) → CPolygon(A, C, B) → t1, b_1, a_1, c_1Segment(A, C) → iSegment(C, B) → jSegment(B, A) → k