
向量场中线段通量的 GeoGebra 演示
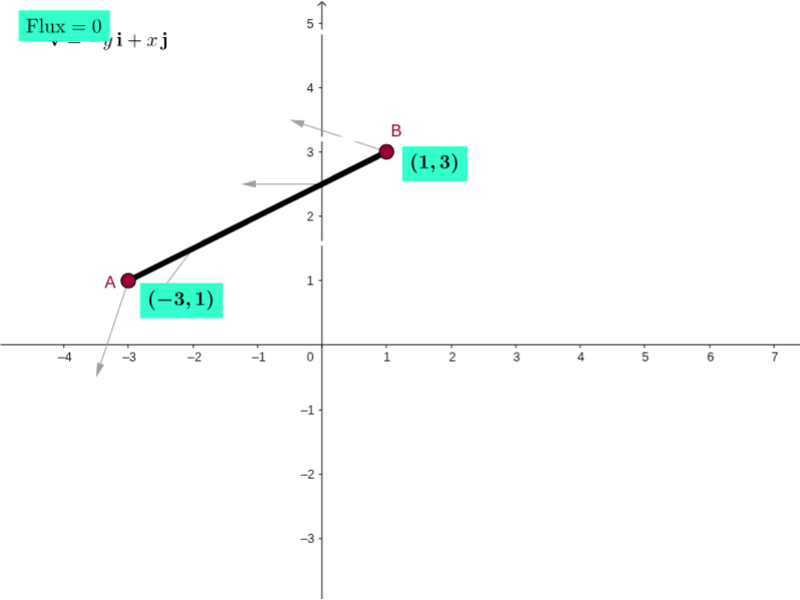
几何画板及绘图内容加载中,请稍等……
本范例在 GeoGebra 中动态演示向量场穿过一条线段或曲线的通量现象,用箭头、粒子轨迹和网格标尺呈现场强方向与大小。核心概念包括向量场、线积分/曲线积分、通量、散度与旋度,以及参数曲线和数值求和近似。作图时利用 CurveCartesian 绘制场域曲线,Sequence 与 Point 生成粒子或采样点,Line、Ray、Midpoint 构造线段与方向,Derivative 与 Sum 计算局部变化及通量近似,Circle、Sector、Mirror、Translate 辅助显示箭头、扇形和对称元素,并通过 vField、particlesList、pathlinesList、curl、div、spokes 等对象组织动画与标注。适合高中数学拓展、大学微积分或向量分析课程,用于直观理解通量、散度、旋度及曲线积分的几何意义。
GeoGebra 命令及参数
Circle((0, 0), 16) → kSequence(Sequence[Vector[(j, k), (j + (scale * F_1(j, k)), k + (scale * F_2(j, k)))], j, xmin, xmax, xstep], k, ymin, ymax, ystep) → vFieldSequence(((x(Element[inicialPts, i]) * cos((w * time))) - (y(Element[inicialPts, i]) * sin((w * time))), (x(Element[inicialPts, i]) * sin((w * time))) + (y(Element[inicialPts, i]) * cos((w * time)))), i, 1, 8) → particlesListSequence(CurveCartesian[(x(Element[inicialPts, i]) * cos((w * t))) - (y(Element[inicialPts, i]) * sin((w * t))), (x(Element[inicialPts, i]) * sin((w * t))) + (y(Element[inicialPts, i]) * cos((w * t))), t, 0, time], i, 1, 8) → pathlinesListCircle(divPt, 0.5) → divGlowCircleSequence(Segment[Rotate[curlPt - (0.5, 0), k + curlAngle, curlPt], Rotate[curlPt + (0.5, 0), k + curlAngle, curlPt]], k, 0, 2.0944, 1.0472) → spokesMidpoint(I, J) → MidPointLine(K, xAxis) → gLine(L, xAxis) → hLine(M, xAxis) → iCurveCartesian((t * x(J)) + ((1 - t) * x(I)), (t * y(J)) + ((1 - t) * y(I)), t, 0, 1) → pathTestCurveCartesian(x(pathTest(i)), y(pathTest(i)), i, 0, s) → partPathTestDerivative(pathTest) → DpathSum(Sequence[(((F_1(x(pathTest(i + dS / 2)), y(pathTest(i + dS / 2))), F_2(x(pathTest(i + dS / 2)), y(pathTest(i + dS / 2)))) * (y(Dpath(i + dS / 2)), (-x(Dpath(i + dS / 2))))) * dS), i, 0, s - dS, dS]) → FluxTestSequence(Vector[pathTest(i), pathTest(i) + ((scale * F_1(x(pathTest(i)), y(pathTest(i)))), (scale * F_2(x(pathTest(i)), y(pathTest(i)))))], i, 0, s, 0.25) → PathVectorsPoint(k) → PRay((0, 0), N) → dTranslate(normalvector_1, PtPath_1) → uSector(k, Q, N) → pMirror(u, PtPath_1) → u'
AI 绘图提示语参考
描述一个展示向量场通量的图形。包含一个向量场(vField),由曲线构成;一些粒子(particlesList)沿着路径运动;路径线(pathlinesList)显示粒子的轨迹;散度(divGlowCircle)表示散度;旋度(curl)用扇形(spokes)表示;网格(scaled grid)用于参考。箭头(Vector)显示方向;测试路径(pathTest)和导数(Dpath)用于计算通量(FluxTest);路径向量(PathVectors)显示粒子运动方向。构造顺序:先绘制网格和向量场,然后添加粒子和路径线,接着添加散度和旋度,最后添加箭头和通量计算。
以上提示语为根据原始绘图命令整理而来,仅供参考。