
求具有最小值点的二次函数方程
几何画板及绘图内容加载中,请稍等……
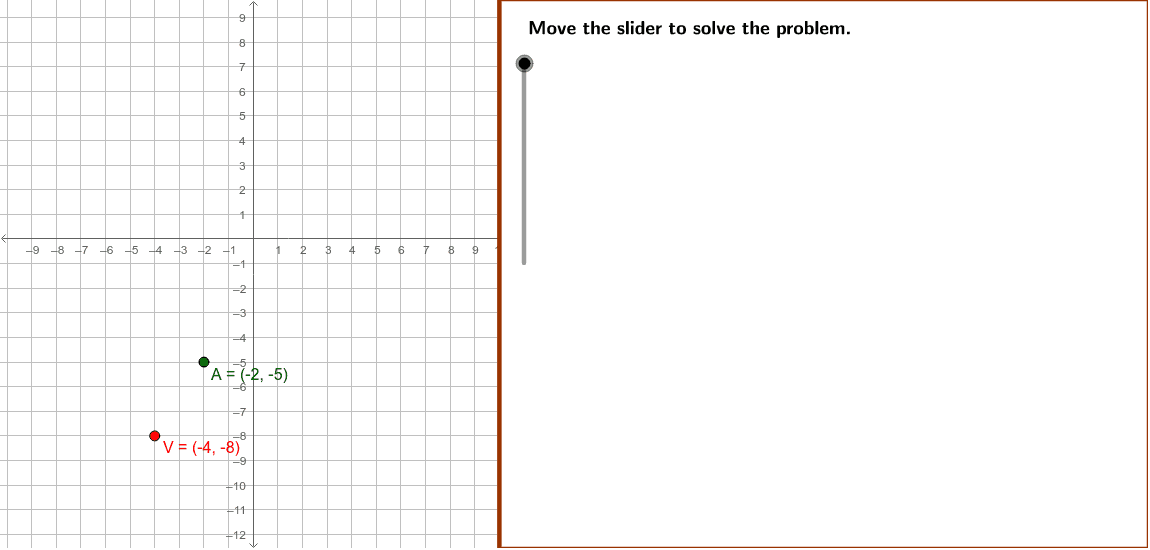
①本范例演示如何确定具有最小值点的二次函数方程;②涉及的核心数学概念包括二次函数、顶点坐标、函数图像、解析几何;③作图要点——从下方『构造摘要』提炼用到了If, Polygon, TableText等GeoGebra命令/对象;④适合高中阶段学习二次函数及其图像的学生使用。
GeoGebra 命令及参数
If(x(B) ≟ x(A), B + (1, 0), B) → VPolygon((edge, y(Corner[1])), Corner[2], Corner[3], (edge, y(Corner[4]))) → Mask, mask1, mask2, mask4, mask3If(abs(b) ≟ 1, If[b ≟ 1, "", "-"], LaTeX[b]) → b1If(abs(c) ≟ 1, If[c ≟ 1, "", "-"], LaTeX[c]) → c1TableText({{"\textit{f}(\textit{x})=\textit{a}(\textit{x} " + (LaTeX[Element[plus, sgn((-x(V))) + 2]]) + "" + (LaTeX[(-x(V))]) + " )^2" + (LaTeX[Element[plus, sgn(y(V)) + 2]]) + "" + (LaTeX[y(V)]), " \text{Equation from step 1.}"}, {" \textit{f}(\textit{x})= \frac{" + (LaTeX[y(A) - y(V)]) + "}{" + ((LaTeX[x(A)^(2)] * "}(\textit{x} ")) + (LaTeX[Element[plus, sgn((-x(V))) + 2]]) + "" + (LaTeX[(-x(V))]) + " )^2 " + (LaTeX[Element[plus, sgn(y(V)) + 2]]) + "" + (LaTeX[y(V)]), " "}}, "l") → Conclusions3TableText({{"\textit{f}(\textit{x})= \textit{a}(\textit{x}-\textit{h})^2+\textit{k}", " \text{Vertex form}"}, {" \textit{f}(\textit{x})=\textit{a}[\textit{x}-(" + (LaTeX[x(V)]) + ")]^2+(" + (LaTeX[y(V)]) + ") ", "\text{Substitute " + (LaTeX[V]) + " for } \textit{h}\text{ and }\textit{k}."}, {" \textit{f}(\textit{x})=\textit{a} (\textit{x}" + (LaTeX[Element[plus, sgn((-x(V))) + 2]]) + "" + (LaTeX[(-x(V))]) + ")^2" + (LaTeX[Element[plus, sgn(y(V)) + 2]]) + "" + (LaTeX[y(V)]), "\text{Simplify.}"}}, "l") → Conclusions1TableText({{"\textit{f}(\textit{x})=\textit{a}(\textit{x}" + (LaTeX[Element[plus, sgn((-x(V))) + 2]]) + " " + (LaTeX[(-x(V))]) + ")^2 " + (LaTeX[Element[plus, sgn(y(V)) + 2]]) + " " + (LaTeX[y(V)]), "\text{Equation from step 1.} "}, {LaTeX[y(A)] + "=\textit{a}[(" + (LaTeX[x(A)]) + ")" + (LaTeX[Element[plus, sgn((-x(V))) + 2]]) + " " + (LaTeX[(-x(V))]) + "]^2" + (LaTeX[Element[plus, sgn(y(V)) + 2]]) + " " + (LaTeX[y(V)]), "\text{Substitute }" + (LaTeX[A]) + "\text{ for } \textit{x} \text{ and }\textit{f}(\textit{x}). "}, {LaTeX[y(A)] + "=a[" + (LaTeX[x(A)]) + "]^2" + (LaTeX[Element[plus, sgn(y(V)) + 2]]) + "" + (LaTeX[y(V)]), "\text{Simplify.}"}, {LaTeX[y(A)] + "=" + (LaTeX[x(A)^(2)]) + "\textit{a}" + (LaTeX[Element[plus, sgn(y(V)) + 2]]) + "" + (LaTeX[y(V)])}, {LaTeX[y(A) - y(V)] + "=" + (LaTeX[x(A)^(2)]) + "\textit{a}", " "}, {" \frac{" + (LaTeX[y(A) - y(V)]) + "}{" + (LaTeX[x(A)^(2)]) + "}=\textit{a} ", " "}}, "l") → Conclusions2
AI 绘图提示语参考
画一个二次函数图像,其顶点在指定点,并经过另一个给定点。首先标出顶点和给定点,然后绘制函数图像。接着,用多边形工具连接顶点和图像上的关键点,形成辅助图形。最后,在图像旁边用文本标注函数的顶点式方程和推导过程,包括从顶点坐标和给定点坐标求得的系数。
以上提示语为根据原始绘图命令整理而来,仅供参考。