
探索直线斜率
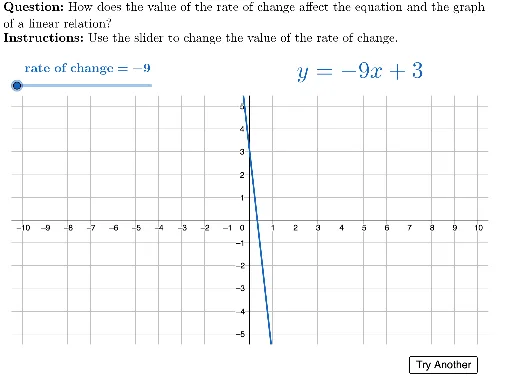
几何画板及绘图内容加载中,请稍等……
①本范例演示如何通过动态调整直线的截距和斜率参数,直观展示直线方程及其图像的变化关系;②涉及的核心数学概念包括直线方程(y=mx+b)、斜率、截距、解析几何;③作图要点——使用了Random命令生成随机数据,LaTeX命令显示数学公式,Polygon命令绘制图形,并利用TryAnother、m、b、f、equation、viewBox、mLabel、QUESTION、INSTRUCTIONS、TEXT等对象实现交互式探索和参数化演示;④适合高中数学学生用于理解直线方程及其图像的几何意义,以及斜率和截距对直线位置的影响。
GeoGebra 命令及参数
Random(-4, 4) → bLaTeX("\vphantom{1}" + f) → equationPolygon({(-10.5, -5.5), (-10.5, 5.5), (10.5, 5.5), (10.5, -5.5)}) → viewBoxLaTeX(("\text{rate of change}=" * m)) → mLabelLaTeX("\textbf{Question: }How does the value of the rate of change affect the equation and the graph\\of a linear relation?") → QUESTIONLaTeX("\textbf{Instructions: }Use the slider to change the value of the rate of change.") → INSTRUCTIONS