
使用相关系数分析数据关系示例
几何画板及绘图内容加载中,请稍等……
所属专题
AP Statistics
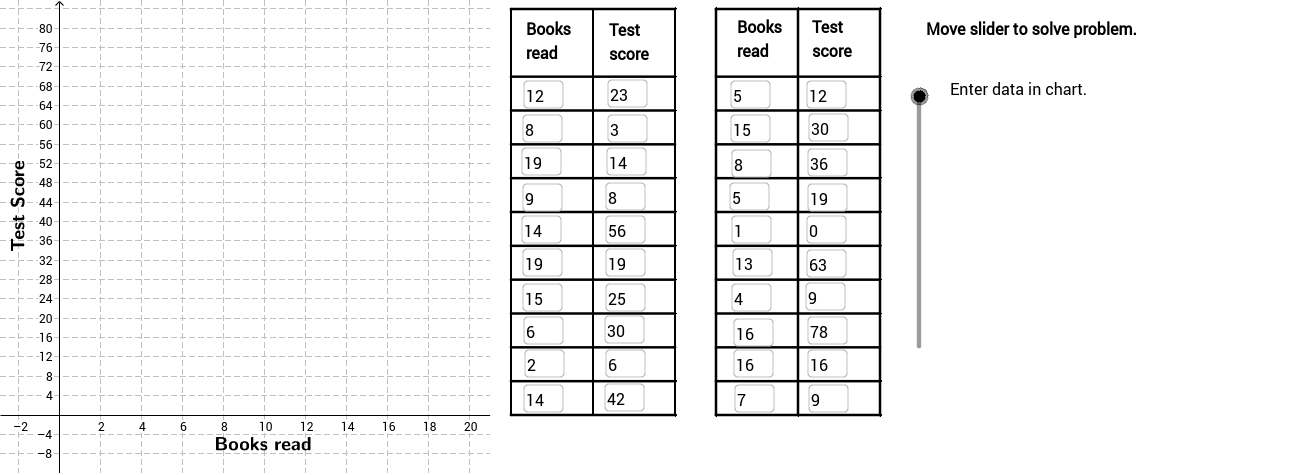
本范例演示如何利用相关系数来描述数据之间的相关性强度。核心数学概念包括线性回归与数据分布分析。作图要点涉及使用GeoGebra命令如FitLineY、PMCC等来构建数据关系图形。适合高中生或大学低年级学生用于学习统计分析基础。
GeoGebra 命令及参数
FitLineY(PointList1) → LineFitPMCC(PointList1) → CorCoeffTextfield(A2) → InA2Textfield(A3) → InA3Textfield(A4) → InA4Textfield(A5) → InA5Textfield(A6) → InA6Textfield(A7) → InA7Textfield(A8) → InA8Textfield(A9) → InA9Textfield(A10) → InA10Textfield(A11) → InA11Textfield(A12) → InA12Textfield(A13) → InA13Textfield(A14) → InA14Textfield(A15) → InA15Textfield(A16) → InA16Textfield(A17) → InA17Textfield(A18) → InA18Textfield(A19) → InA19Textfield(A20) → InA20Textfield(A21) → InA21Textfield(B2) → InB2Textfield(B3) → InB3Textfield(B4) → InB4Textfield(B5) → InB5Textfield(B6) → InB6Textfield(B7) → InB7Textfield(B8) → InB8Textfield(B9) → InB9Textfield(B10) → InB10Textfield(B11) → InB11Textfield(B12) → InB12Textfield(B13) → InB13Textfield(B14) → InB14Textfield(B15) → InB15Textfield(B16) → InB16Textfield(B17) → InB17Textfield(B18) → InB18Textfield(B19) → InB19Textfield(B20) → InB20Textfield(B21) → InB21Sequence(Segment[(22, 0 + 7 * i), (30, 0 + 7 * i)], i, 0, 10) → Linesh1Sequence(Segment[(32, 0 + 7 * i), (40, 0 + 7 * i)], i, 0, 10) → Linesh2Sequence(Segment[(22 + 4 * i, 0), (22 + 4 * i, 84)], i, 0, 2) → Linesv1Sequence(Segment[(32 + 4 * i, 0), (32 + 4 * i, 84)], i, 0, 2) → Linesv2Segment((22, 84), (30, 84)) → top1Segment((32, 84), (40, 84)) → top2If(LineVisible, "Hide Best Fit Line", "Show Best Fit Line") → LineButtonPolygon((21, y(Corner[1])), Corner[2], Corner[3], (21, y(Corner[4]))) → poly1, a, b, c, dRotateText("Test Score", 90*°) → SideLegendRotateText("Books read", 0) → BottomLegendIf(CorVisible, "Hide Correlation Coefficient", "Show Correlation Coefficient") → CorButton
AI 绘图提示语参考
画一个数据关系图,展示如何用相关系数描述数据强度,包含线性回归线和数据分布分析。先画出两组数据点,用一条线拟合这些点来表示线性回归,并标注相关系数。再添加水平和垂直辅助线,将图表区域划分为四个部分,最后连接顶部边界。
以上提示语为根据原始绘图命令整理而来,仅供参考。