
多项式函数的导数
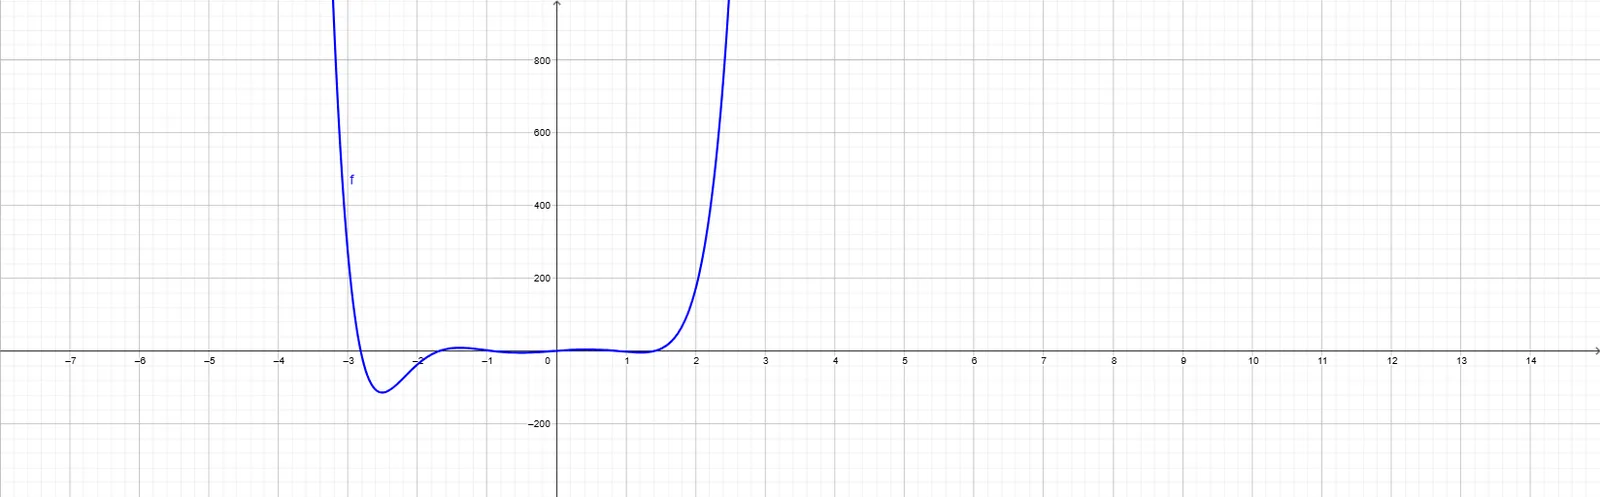
几何画板及绘图内容加载中,请稍等……
①本范例演示了多项式函数及其导数的图像变化关系;②涉及核心数学概念包括导数、函数图像、极值点、转折点等;③作图要点使用了GeoGebra的Textfield, Root, Extremum, TurningPoint, LaTeX命令及对象,如a_8至a_0变量、多个InputBox和文本对象;④适合高中及以上学生学习和理解微积分基础概念及多项式函数特性。
GeoGebra 命令及参数
Textfield(a_3) → InputBox1Textfield(a_2) → InputBox2Textfield(a_1) → InputBox3Textfield(a_0) → InputBox4Textfield(a_4) → InputBox5Textfield(a_5) → InputBox6Textfield(a_6) → InputBox7Textfield(a_7) → InputBox8Textfield(a_8) → InputBox9Root(f) → A, B, C, E, J, K, L, MRoot(f') → F, G, H, I, N, O, PExtremum(f) → Q, R, S, T, U, V, WTurningPoint(f) → Z, A_1, B_1, C_1, D_1, E_1Extremum(f') → F_1, G_1, H_1, I_1, J_1, K_1Textfield(xmin) → InputBox10Textfield(xmax) → InputBox11Textfield(ymin) → InputBox12Textfield(ymax) → InputBox13LaTeX(text6, true, true) → text5
AI 绘图提示语参考
绘制一个多项式函数及其导数的图形,包括函数的根、极值点和拐点。输入多项式系数 a_8 到 a_0,调整 x 和 y 轴的范围。首先输入系数,然后根据输入的系数绘制多项式函数 f(x),接着计算并绘制其导数 f'(x),标出所有根、极值点和拐点。
以上提示语为根据原始绘图命令整理而来,仅供参考。