
累积频率分布
几何画板及绘图内容加载中,请稍等……
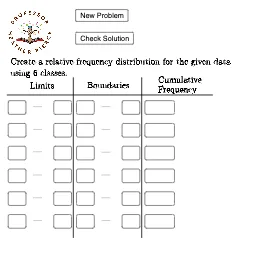
①本范例演示如何通过GeoGebra绘制累积频率分布图;②涉及的核心数学概念包括频率分布、统计学、散点图、线性方程;③作图要点:使用Random, Min, Max, Textfield, Segment, CountIf等命令,对象包括A1至A11, B1至B11, C1至C11等,构建数据点和累积频率线;④适合高中统计课程教学或数据分析入门学习。
GeoGebra 命令及参数
Random(50, 99) → A1Random(50, 99) → B1Random(50, 99) → C1Random(50, 99) → C2Random(50, 99) → B2Random(50, 99) → A2Random(50, 99) → A3Random(50, 99) → B3Random(50, 99) → C3Random(50, 99) → C4Random(50, 99) → B4Random(50, 99) → A4Random(50, 99) → A5Random(50, 99) → B5Random(50, 99) → C5Random(50, 99) → C6Random(50, 99) → B6Random(50, 99) → A6Random(50, 99) → A7Random(50, 99) → B7Random(50, 99) → C7Random(50, 99) → C8Random(50, 99) → B8Random(50, 99) → A8Random(50, 99) → A9Random(50, 99) → B9Random(50, 99) → C9Random(50, 99) → C10Random(50, 99) → B10Random(50, 99) → A10Random(50, 99) → A11Random(50, 99) → B11Random(50, 99) → C11Random(50, 99) → C12Random(50, 99) → B12Random(50, 99) → A12Random(50, 99) → A13Random(50, 99) → B13Random(50, 99) → C13Random(50, 99) → C14Random(50, 99) → B14Random(50, 99) → A14Random(50, 99) → A15Random(50, 99) → B15Random(50, 99) → C15Min(Data) → minMax(Data) → maxTextfield(lower1) → InputBox1Textfield(lower2) → InputBox2Textfield(lower3) → InputBox3Textfield(lower4) → InputBox4Textfield(lower5) → InputBox5Textfield(lower6) → InputBox6Textfield(upper1) → InputBox7Textfield(upper2) → InputBox8Textfield(upper3) → InputBox9Textfield(upper4) → InputBox10Textfield(upper5) → InputBox11Textfield(upper6) → InputBox12Segment(A, B) → fSegment(C, D) → gTextfield(lboundary1) → InputBox13Textfield(lboundary2) → InputBox14Textfield(lboundary3) → InputBox15Textfield(lboundary4) → InputBox16Textfield(lboundary5) → InputBox17Textfield(lboundary6) → InputBox18Textfield(uboundary1) → InputBox19Textfield(uboundary2) → InputBox20Textfield(uboundary3) → InputBox21Segment(E, F) → hTextfield(frequency1) → InputBox25Textfield(frequency2) → InputBox26Textfield(frequency3) → InputBox27Textfield(frequency4) → InputBox28Textfield(frequency5) → InputBox29Textfield(frequency6) → InputBox30Textfield(uboundary4) → InputBox22Textfield(uboundary5) → InputBox23Textfield(uboundary6) → InputBox24CountIf(l1 ≤ x ≤ u1, Data) → f1
AI 绘图提示语参考
绘制一个累积频率分布图。首先在坐标平面上生成若干随机数据点,这些点的横纵坐标均在50到99之间,形成散点图。然后计算这些数据的最小值和最大值,用于确定坐标轴范围。接着,根据数据点绘制累积频率折线,从最小值开始,逐步累加每个区间内的数据点数量,直到最大值,形成一条上升的阶梯状或平滑曲线。最后,在图形旁添加一个文本输入框,用于调整分组下限,以便动态观察累积频率分布的变化。整体图形应包含散点、累积频率曲线和交互输入框。
以上提示语为根据原始绘图命令整理而来,仅供参考。