
公司员工增长模型
几何画板及绘图内容加载中,请稍等……
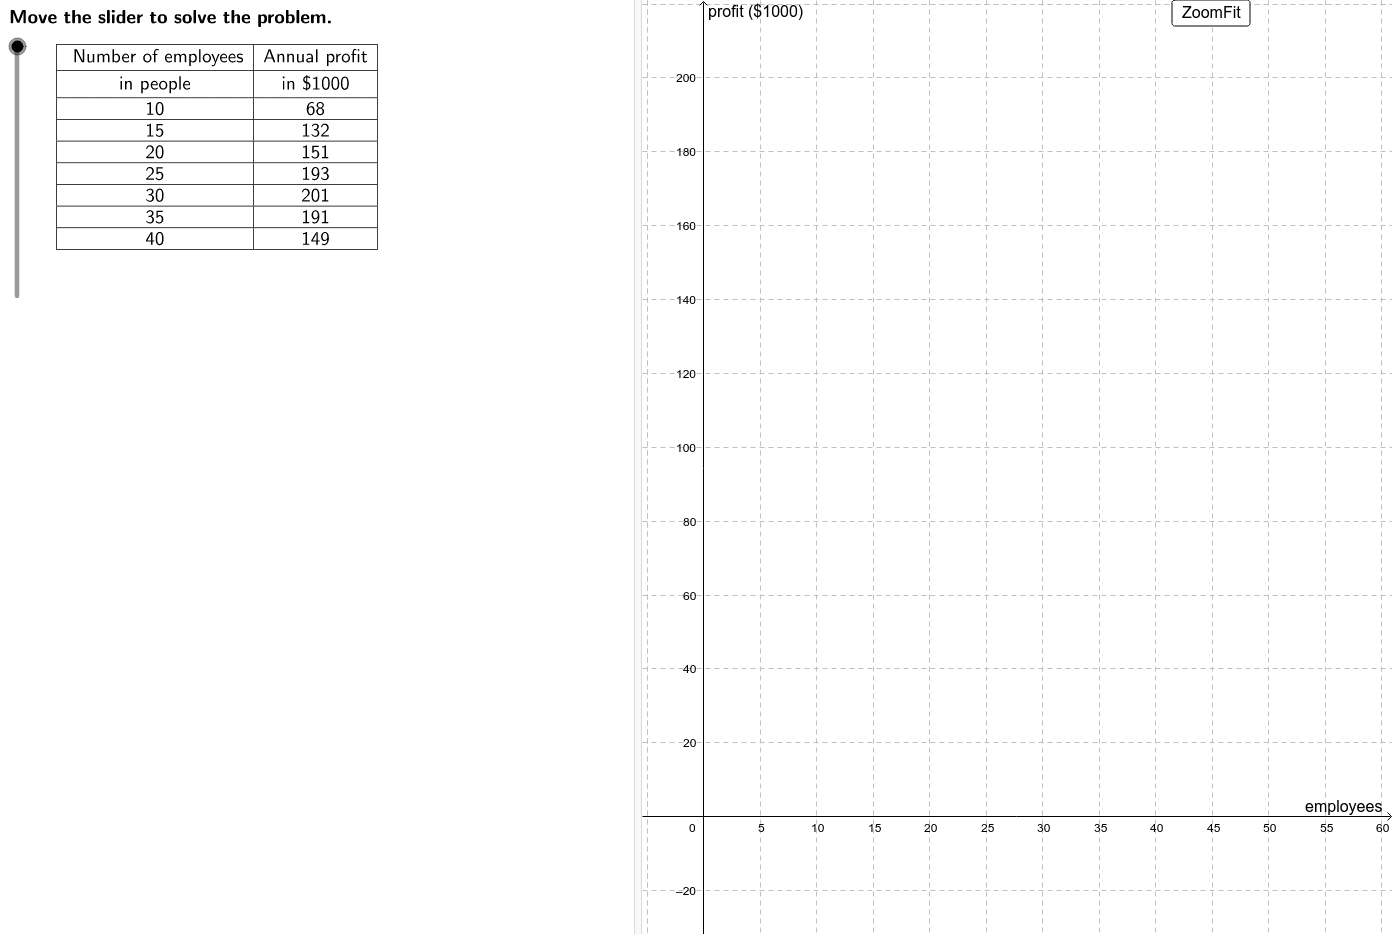
①本范例演示了公司员工数量随时间增长的散点图与对数趋势线;②涉及核心数学概念包括对数函数、散点图绘制、最优员工数量计算;③作图要点提炼自构造摘要,使用了Intersect(交点计算)、LaTeX(公式显示)、Corner(边界设置)、TableText(表格文本)、Max(最大值)、If(条件判断)等GeoGebra命令与对象;④适合高中及以上数学教学,用于概率统计与优化问题教学。
GeoGebra 命令及参数
Intersect(f, xAxis) → minEmp, maxEmpLaTeX(steps) → counterLaTeX("\text{Move the slider to solve the problem.}") → text0Corner(1) → ACorner(3) → BTableText({{LaTeX["\text{ Number of employees}"], LaTeX["\text{in people}"], A2, A3, A4, A5, A6, A7, A8}, {LaTeX["\text{Annual profit}"], LaTeX["\text{in \$1000}"], B2, B3, B4, B5, B6, B7, B8}}, "_|cv") → dataLaTeX(data) → ProblemMax({B2, B3, B4, B5, B6, B7, B8}) → maxProfitLaTeX("\text{Create a scatter plot of the data.}") → text1If(set ≟ 1, (A6, B6), If[set ≟ 2, (A5, B5), (A4, B4)]) → vertexLaTeX("\text{Vertex form of a quadratic function}") → text6LaTeX("\textcolor{#006633}{y–k=a(x–h)^2}") → text7LaTeX((((("\textcolor{#006633}{y–" * y(vertex)) * "=a(x–(") * x(vertex)) * "))^2}")) → text9LaTeX((((((((("\textcolor{#006633}{" * B2) * "–") * y(vertex)) * "=a(") * A2) * "–(") * x(vertex)) * "))^2}")) → text11LaTeX((((((((("\textcolor{#006633}{" * B2) * "–") * y(vertex)) * "=a(") * A2) * "–(") * x(vertex)) * "))^2}")) → text12LaTeX("\text{Simplify.}") → text13LaTeX((((("\textcolor{#006633}{" * LHS) * "=a(") * RHS) * ")}")) → text14LaTeX((("\text{Divide by }\textcolor{#006633}{" * RHS) * "}.")) → text15LaTeX((((("\textcolor{#006633}{a=\frac{" * LHS) * "}{") * RHS) * "}}")) → text16LaTeX("\text{Simplify.}") → text17LaTeX((("\textcolor{#006633}{a=" * a) * "}")) → text18LaTeX("\textcolor{#006633}{y–k=a(x–h)^2}") → text21LaTeX("\text{Substitute.}") → text22LaTeX((((((("\textcolor{#006633}{y-" * y(vertex)) * "=") * a) * "(x-(") * x(vertex)) * "))^2}")) → text23LaTeX((((((("\textcolor{#006633}{y-" * y(vertex)) * "=") * a) * "(x-(") * x(vertex)) * "))^2}")) → text24LaTeX("\text{Expand the squared term.}") → text25LaTeX((((((((("\textcolor{#006633}{y-" * y(vertex)) * "=") * a) * "(x^2-") * twiceVertex) * "x+") * vertsq) * ")}")) → text26LaTeX((("\text{Distribute }\textcolor{#006633}{" * a) * "}.")) → text27LaTeX((((((((("\textcolor{#006633}{y-" * y(vertex)) * "=") * a) * "x^2+(") * b) * ")x+(") * avertsq) * ")}")) → text28LaTeX((("\text{Add }\textcolor{#006633}{" * y(vertex)) * "}\text{ to both sides.}")) → text29LaTeX((((((("\textcolor{#006633}{y=" * a) * "x^2 + (") * b) * ")x + (") * c) * ")}")) → text30LaTeX((((((("\text{An equation modeling the given data is }\cr\textcolor{#006633}{y=" * a) * "x^2 + (") * b) * ")x + (") * c) * ")}.")) → text31LaTeX("\text{Graph this equation on the same graph as the scatter}\cr\text{plot to see if it is a good fit.}") → text32LaTeX("\text{This equation appears to be a good fit for the data}\cr\text{because it approximates the shape of the curve}\cr\text{suggested by the scatter plot, with points above,}\cr\text{below, and directly on the curve.}") → text33LaTeX((("\text{Substitute the point that appears to }\cr\text{be the vertex, }\textcolor{#CC0000}{" * vertex) * "}\text{, for }\textcolor{#006633}{(h, k)}. ")) → text8LaTeX((("\text{Substitute another point, the first}\cr\text{one, }\textcolor{#CC0000}{" * otherpt) * "},\text{ is convenient, for }\textcolor{#006633}{(x,y).}")) → text10LaTeX("\text{Use the vertex to determine an equation that models this data.}") → text5LaTeX("\text{Vertex form}") → text20LaTeX((((("\text{To write the equation of the parabola, substitute }\textcolor{#CC0000}{" * vertex) * "}\text{ for }\textcolor{#006633}{(h, k)}\cr\text{and substitute }\textcolor{#006633}{") * a) * "}\text{ for }\textcolor{#006633}{a}\text{ into the vertex form of a quadratic }\cr\text{function. Then simplify. }")) → text19LaTeX("\text{Assuming the profitability of this company really depends solely }\cr\text{on the number of employees, an unikely state of affairs, use the }\cr\text{model to predict the minimum and maximum number of employees }\cr\text{the company can have without losing money.}") → text34LaTeX("\text{Use the graph of the model function to approximate the zeros }\cr\text{of the function.}") → text35LaTeX((((("\text{This model suggests that the company is only profitable when it }\cr\text{has between }\textcolor{#006633}{" * lowest) * "}\text{ and }\textcolor{#006633}{") * highest) * "}\text{ employees. Note that the minimum should}\cr\text{be rounded up to the nearest whole person while the maximum }\cr\text{number should be rounded down. This ensures that profit in each }\cr\text{case is greater than or equal to zero.")) → text36LaTeX("\text{Use the buttons below to return to the original problem or randomly }\cr\text{generate a similar practice problem.}") → RandomizationTextLaTeX("\text{Let the x-axis represent the number of employees and the y-axis}\cr\text{ represent the company’s annual profit.}") → text2LaTeX("\text{Use the scatter plot to determine the type of model that represents }\cr\text{this data.}") → text3LaTeX("\text{The points in the scatter plot appear to form the shape of a }\cr\text{parabola.Therefore, the model will be in the form of a quadratic }\cr\text{function: }\textcolor{#006633}{f(x) = ax^2 + bx + c}\text{. We can find an equation to model }\cr\text{this parabola algebraically by using the vertex of the quadratic.}") → text4
AI 绘图提示语参考
绘制一家公司的员工数量与年度利润之间的关系图。首先,创建一个散点图来表示员工数量和年度利润的数据点。接着,通过散点图中的顶点,构建一个顶点形式的二次函数模型。利用模型预测公司盈利的最小和最大员工数量,并在图上标注这些值。最后,根据散点图的形状,添加一条对数趋势线来更好地展示数据的变化趋势。
以上提示语为根据原始绘图命令整理而来,仅供参考。