
随机变量的组合
几何画板及绘图内容加载中,请稍等……
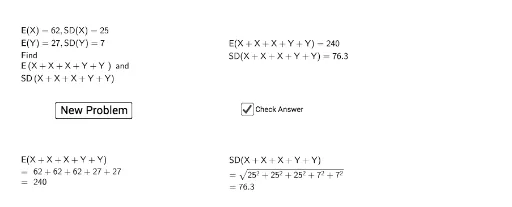
①本范例演示如何通过 GeoGebra 组合随机变量并可视化其结果;②涉及核心数学概念包括随机变量、概率统计、期望值计算;③作图要点:使用了 Join(连接)、Random(随机数生成)、Sum(求和)、Text(文本显示)等命令,以及 L_1, xx, yy, L_2, L_3, text1 等对象;④适合高中及以上学生学习概率统计和数据分析,也可用于教学演示。
GeoGebra 命令及参数
Join({Sequence["X+", a, 1, 5], {"X"}}) → L_1Random(1, 6) → xxRandom(1, 6) → yyJoin({Sequence["Y+", a, 1, 5], {"Y"}}) → L_2Join({Take[L_1, 7 - xx, 6], {"+"}, Take[L_2, 7 - yy, 6]}) → L_3Sum(L_3) → text1Random(20, 100) → ex1Random(20, 50) → ex2Random(5, 15) → sd2Random(10, 25) → sd1Text(ex1) → text4Join({Sequence[text4 + "+", a, 1, xx - 1], {text4}}) → L_4Sum(L_4) → text5Text(ex2) → text6Sum(Join[{Sequence[text6 + "+", a, 1, yy - 1], {text6}}]) → text7Text(sd1) → text9Text(sd2) → text10Join({Sequence[text9 + "²" + "+", a, 1, xx - 1], {text9 + "²"}}) → L_5Join({Sequence[text10 + "²" + "+", a, 1, yy - 1], {text10 + "²"}}) → L_6