
使用弹球模拟比较理论概率与实验概率
几何画板及绘图内容加载中,请稍等……
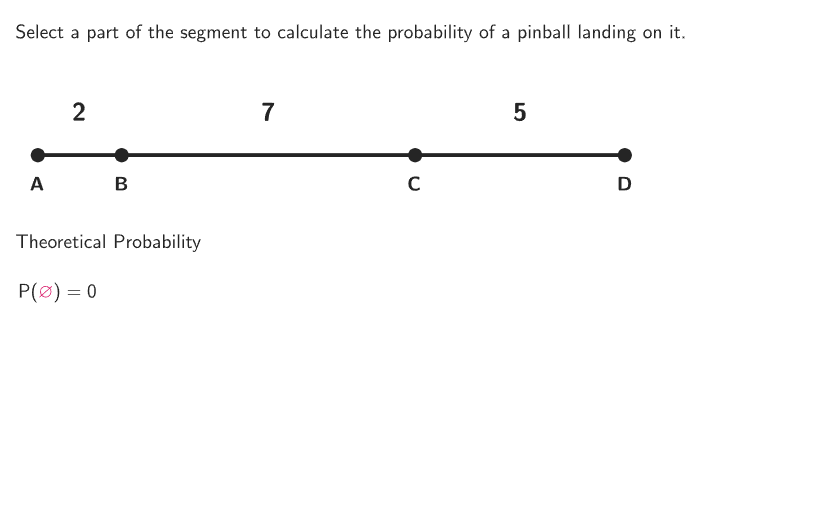
这个范例通过模拟弹球运动来演示概率计算。核心数学概念是几何概率,即利用图形区域的比例来计算概率。作图要点包括使用GeoGebra命令如RandomUniform、Line、Segment等来构造弹球路径和区域。适合6-8年级学生,用于理解概率与几何的结合。
GeoGebra 命令及参数
RandomUniform(0, 0.99, 200) → allRandomSeeds, {0.785694756253163, 0.9806807303442829, 0.4744696787349965, 0.07302956912855027, 0.6002911955890478, 0.41685885562467967, 0.6861535088471415, 0.047571139460948306, 0.3954983311529015, 0.7097217494407272, 0.24800847363370232, 0.2201887275198625, 0.8106600284811379, 0.5363199874340305, 0.5253245889388841, 0.5246633761588722, 0.2684459430993198, 0.15901160380693782, 0.8667465453496013, 0.8024028540295866, 0.5334640264145052, 0.9530060467445283, 0.45942020793128985, 0.8930432233486214, 0.356136941967206, 0.4730930985799898, 0.03231489525644536, 0.03427510264778363, 0.4900763763991845, 0.9214011190905512, 0.08245423274434464, 0.17263588028993462, 0.7944204085717418, 0.1524329391380891, 0.8462389362157464, 0.014383224618356555, 0.35177010880420334, 0.2494697045735961, 0.9864338778301837, 0.631374254747728, 0.6974681000705967, 0.7377123568218829, 0.5747174479578188, 0.48112456830770295, 0.9570073319406002, 0.05424704507426261, 0.8099557658651568, 0.16290525668751152, 0.5353403914783431, 0.09307487583335723, 0.5935644933956055, 0.7728600196182621, 0.8947799112038506, 0.4150390218217557, 0.7654605276350136, 0.9606849640006532, 0.1170374688490024, 0.8575103835551244, 0.8871813716352823, 0.4984111973212997, 0.38974418209889955, 0.8371607062709006, 0.04276399973916673, 0.36826662980233515, 0.2885278415926325, 0.5010557766321515, 0.14292612970015536, 0.5614657229443936, 0.9223915377994091, 0.7766436393187238, 0.23398160721307087, 0.3230869059872952, 0.8627466581400911, 0.9499913671869552, 0.9497473620563281, 0.4899454180414229, 0.15499719289750144, 0.6938415340248048, 0.6024636135148606, 0.778554525500967, 0.4160555752506634, 0.7527130928520013, 0.05744988634133021, 0.1488917247792147, 0.79158947294477, 0.39136377614034673, 0.9058579356164059, 0.15674630906194814, 0.8631568495785614, 0.3254599436486467, 0.33045925304250096, 0.30292347558341715, 0.7676815257567239, 0.5492667937899818, 0.02091809600380783, 0.39151523299042396, 0.16995335016046006, 0.5745764944987947, 0.09745238985940329, 0.7018214036667263, 0.7230079294747065, 0.7479326779873388, 0.6451733855073069, 0.5093150624508108, 0.37134718256829985, 0.18949021456121806, 0.9857213901295837, 0.5502940849936204, 0.6080081302378343, 0.38656497043081506, 0.8980781965514182, 0.562546500669413, 0.8884685570048507, 0.11808308075105671, 0.3366380779753214, 0.53048034522324, 0.09229904431357008, 0.2427311109017028, 0.4217582719680741, 0.35772915928134114, 0.8473277017273857, 0.22363729202771557, 0.8760857030800236, 0.8432422247225062, 0.8608791189671421, 0.6858814385828887, 0.3189702167493783, 0.4383044995215036, 0.688381476205186, 0.100034899476585, 0.2712261132311666, 0.871803822858032, 0.22130561896066775, 0.7252741879877513, 0.27339245307116583, 0.15937404203784403, 0.5340071534728592, 0.42939072833354924, 0.6724683813586252, 0.3787901810435957, 0.3425879566634997, 0.3402363811935522, 0.4048638553228518, 0.8091777811354688, 0.9483754907779045, 0.5237985471231233, 0.37700699179482017, 0.415221311845558, 0.27403857450203734, 0.8681902562229618, 0.8096880315685927, 0.19961732988815506, 0.09171531457403852, 0.8103702214868501, 0.28779633697338197, 0.3875157327770149, 0.5098242198587452, 0.453374757088205, 0.8936198643550596, 0.04562857702831169, 0.3284617168304894, 0.4562470481370943, 0.6693287220355588, 0.846058368672597, 0.6124591727811451, 0.6166920572648316, 0.8526518421024316, 0.18070859595805502, 0.966280140341301, 0.3777637072399701, 0.5790832850317251, 0.026387527950223585, 0.355983185473702, 0.654608531468472, 0.9742172734387733, 0.4334012401169554, 0.5804584868852238, 0.3454438000042206, 0.7210128162810492, 0.1415555289848067, 0.2470658340787871, 0.38254005161261584, 0.6189275100302891, 0.5470464674681815, 0.9456594890398617, 0.9240072991386645, 0.8149356411662082, 0.07171770402843557, 0.49977993107852225, 0.30565114721404335, 0.9704603956608897, 0.652597806210376, 0.8845254426202807, 0.44406888633110203, 0.6431999998667703, 0.8445045413039075, 0.7572856914476114, 0.4274978987478695, 0.048717295771883884, 0.10181277581867074}Take(allRandomSeeds, randIndex, randIndex + numRandoms - 1) → currentRandomSeedsRemoveUndefined(Zip[If[n, m], n, chosenSegs, m, boolPoss]) → boolSuccessIndexOf(true, boolSegs) → chosenIndLine((5.35, -1.9), (5.85, -1.85)) → guideLine2Angle(guideLine2, xAxis) → βSegment((5.35, -1.9), (5.85, -1.85)) → pinballBottomIntersect(pinballBottom, guideLine) → PullSeg1Intersect(y = -3, guideLine) → PullSeg2Segment(PullSeg1, PullSeg2) → pullSegNewPoint(pullSegNew) → PullPointAZip(Text[n, k - (lettWidth / 2, ((-lettHeight)) / 2 + 0.4) + sizeVect, true, true], n, {"A", "B", "C", "D"}, k, Points) → pointLabelsSegment((5.6, -2.14), (5.6, -3)) → pullSegSum(Zip[If[n, m, 0], n, chosenSegs, m, numSegs]) → topPolygon(Zip[PixelsToPoint[Corner[1], Corner[3], Corner[5], A], A, {(pixelsLeft, pixelsTop), (pixelsLeft, y(Corner[5]) - pixelsBottom), Corner[5] - (pixelsRight, pixelsBottom), (x(Corner[5]) - pixelsRight, pixelsTop)}]) → borderBoxCorner(5) → layoutAppSizeSegment((-4, 0), (4, 0)) → segmentStartSequence(Midpoint[Points(n), Points(n + 1)], n, 1, 3) → MidSegsFirst(textSteps, If[step ≟ 1, 1, step - 1]) → textCurrentStepsZip(Text[n, k - (numWidth / 2, -0.85) - numVect, true, true], n, {randomNum2, randomNum1 - (randomNum2 + randomNum3), randomNum3}, k, MidSegs) → textSegsFlatten({Sequence[Midpoint[MidSegs(n), MidSegs(n + 1)], n, 1, 2], (4.8, 0)}) → SignMidsZip(Text[n, k - (numWidth / 2, -0.85) - numVect, true, true], n, {"+", "+", "=\hspace{0.5cm}" + randomNum1}, k, SignMids) → textPlusStep2Segment(Points(numSegUse1), Points(numSegUse1 + 2)) → segmentProbCurveCartesian((0.25 * sin(t)) + 5.6, (-0.25 * ((curvFunct(yDiff) * t / ((pi * 6))) + cos(t) + 7.55)), t, 0, ((2 * pi) * 6)) → curAngle((0, 0), Intersect[guideLine, xAxis], PullSeg1) → αRotate(cur, (-(pi / 2 - α))) → cur'Translate(cur', (-0.23, -0.6)) → cur''Rotate(Polygon[{PullPointA + (0, 1 / ((2 * sqrt(3)))), PullPointA + (-1 / 4, -1 / ((4 * sqrt(3)))), PullPointA + (1 / 4, -1 / ((4 * sqrt(3))))}], (-β), PullPointA) → pullTriangleIntegralBetween(pinBallBTop, pinBallBottom, 4.2, 5.3) → shadingIntegralBetween(pinBallBTop, guideLine2, 5.3, 5.8) → shading2Line(PullSeg1, PullSeg2) → pullLineSegment(PointArrow1, PointArrow2) → arrowSegSegment(Points(1), Points(2)) → segment1Segment(Points(2), Points(3)) → segment2Segment(Points(3), Points(4)) → segment3Zip(Text[n, k - (numWidth / 2, -0.85) - numVect, true, true], n, Zip[If[n, m, ""], n, chosenSegs, m, numSegs], k, MidSegs) → textSegs3If(Defined[chosenInd] ∧ Length[chosenSignMids(chosenInd)] > 0, Sequence["+", n, 1, Length[chosenSignMids(chosenInd)]], {}) → plusSeqZip(Text[n, k - (numWidth / 2, -0.85) - numVect, true, true], n, If[Length[plusSeq] > 0, Flatten[{plusSeq, "=\hspace{0.5cm}" + top}], {"=\hspace{0.5cm}" + top}], k, Flatten[{If[Defined[chosenInd], chosenSignMids(chosenInd), {}], Element[SignMids, 3]}]) → textPlusStep3
AI 绘图提示语参考
画一个模拟弹珠运动的几何图形,展示理论概率和实验概率的比较。首先画一条水平线作为起点,然后画一个倾斜的线段作为弹珠路径,接着画两条垂直线段作为弹珠的起点和终点。在路径上随机选择几个点,用这些点画出几条线段表示弹珠的运动路径。计算并标注角度和线段长度,用阴影表示弹珠在不同区域的概率。最后,画出一个三角形表示弹珠的运动方向,并在路径上标注概率值。
以上提示语为根据原始绘图命令整理而来,仅供参考。