
记录每日步行里程的数据集分析
几何画板及绘图内容加载中,请稍等……
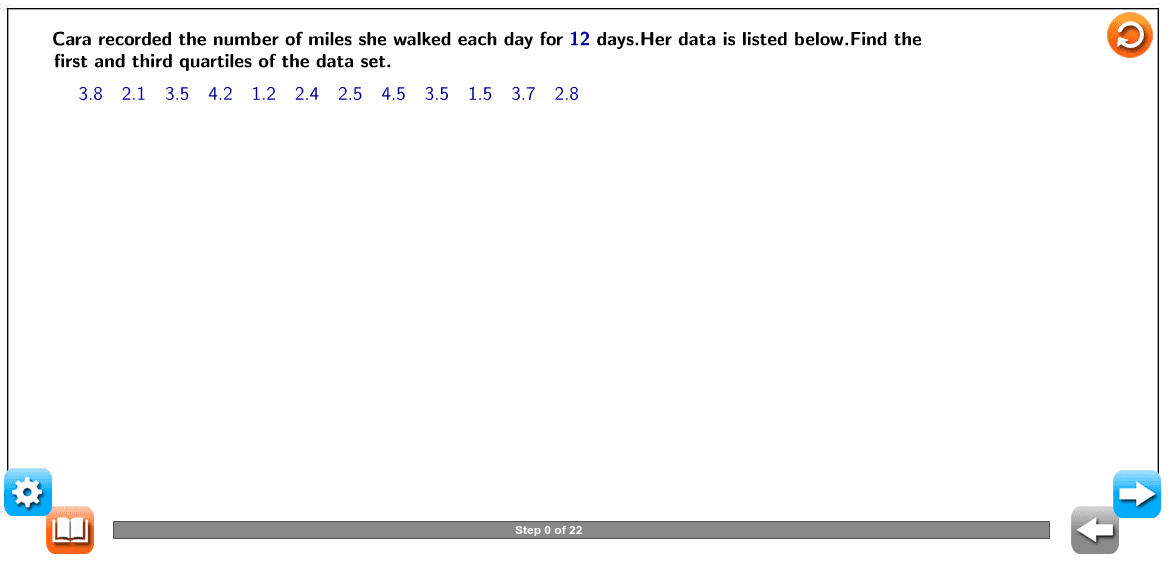
①本范例演示如何通过GeoGebra分析记录的每日步行里程数据集;②涉及的核心数学概念包括数据排序、四分位数计算、统计图表绘制;③作图要点提炼自构造摘要,使用了Sort, Element, LaTeX, roundFix, TableText等命令,以及Equaliser系列对象进行数据整理与展示;④适合高中数学统计与数据分析课程,用于教学演示或学生练习。
GeoGebra 命令及参数
Sort(list2) → AsortElement(Asort, 4) → Asort4Element(Asort, 3) → Asort3LaTeX("\text{first and third quartiles of the data set.}") → text1roundFix(val1, 1) → R1roundFix(val2, 1) → R2roundFix(val3, 1) → R3roundFix(val4, 1) → R4roundFix(val5, 1) → R5roundFix(val6, 1) → R6roundFix(val7, 1) → R7roundFix(val8, 1) → R8roundFix(val9, 1) → R9roundFix(val10, 1) → R10roundFix(val11, 1) → R11roundFix(val12, 1) → R12LaTeX((("\text{" * R10) * "}")) → Equaliservalue10LaTeX((("\text{" * R11) * "}")) → Equaliservalue11LaTeX((("\text{" * R12) * "}")) → Equaliservalue12LaTeX((("\text{" * R2) * "}")) → Equaliservalue2LaTeX((("\text{" * R3) * "}")) → Equaliservalue3LaTeX((("\text{" * R4) * "}")) → Equaliservalue4LaTeX((("\text{" * R5) * "}")) → Equaliservalue5LaTeX((("\text{" * R6) * "}")) → Equaliservalue6LaTeX((("\text{" * R7) * "}")) → Equaliservalue7LaTeX((("\text{" * R8) * "}")) → Equaliservalue8LaTeX((("\text{" * R9) * "}")) → Equaliservalue9TableText({{LaTeX[(("\text{\textcolor{#000099}{" * R1) * "}}")], LaTeX[(("\text{\textcolor{#000099}{" * R2) * "}}")], LaTeX[(("\text{\textcolor{#000099}{" * R3) * "}}")], LaTeX[(("\text{\textcolor{#000099}{" * R4) * "}}")], LaTeX[(("\text{\textcolor{#000099}{" * R5) * "}}")], LaTeX[(("\text{\textcolor{#000099}{" * R6) * "}}")], LaTeX[(("\text{\textcolor{#000099}{" * R7) * "}}")], LaTeX[(("\text{\textcolor{#000099}{" * R8) * "}}")], LaTeX[(("\text{\textcolor{#000099}{" * R9) * "}}")], LaTeX[(("\text{\textcolor{#000099}{" * R10) * "}}")], LaTeX[(("\text{\textcolor{#000099}{" * R11) * "}}")], LaTeX[(("\text{\textcolor{#000099}{" * R12) * "}}")]}}) → QuestionText1LaTeX("\text{Order the data values from least to greatest. }") → text2LaTeX("\text{Find the smallest number of the remaining numbers in the original set and use it as the second number in the ordered list.}") → text5LaTeX("\text{Continue this process until all the numbers in the original list are crossed out.}") → text7Sort(list1) → sortElement(sort, 1) → sort1Element(sort, 2) → sort2Element(sort, 3) → sort3Element(sort, 4) → sort4Element(sort, 5) → sort5Element(sort, 6) → sort6Element(sort, 7) → sort7Element(sort, 8) → sort8Element(sort, 9) → sort9Element(sort, 10) → sort10Element(sort, 11) → sort11Element(sort, 12) → sort12TableText({{LaTeX[(("\text{\textcolor{#000099}{" * sort1) * "}}")], LaTeX[(("\text{\textcolor{#000099}{" * sort2) * "}}")], LaTeX[(("\text{\textcolor{#000099}{" * sort3) * "}}")], LaTeX[(("\text{\textcolor{#000099}{" * sort4) * "}}")], LaTeX[(("\text{\textcolor{#000099}{" * sort5) * "}}")], LaTeX[(("\text{\textcolor{#000099}{" * sort6) * "}}")], LaTeX[(("\text{\textcolor{#000099}{" * sort7) * "}}")], LaTeX[(("\text{\textcolor{#000099}{" * sort8) * "}}")], LaTeX[(("\text{\textcolor{#000099}{" * sort9) * "}}")], LaTeX[(("\text{\textcolor{#000099}{" * sort10) * "}}")], LaTeX[(("\text{\textcolor{#000099}{" * sort11) * "}}")], LaTeX[(("\text{\textcolor{#000099}{" * sort12) * "}}")]}}) → text9TableText({{LaTeX[(("\text{\textcolor{#000099}{" * sort1) * "}}")], LaTeX[(("\text{\textcolor{#000099}{" * sort2) * "}}")], LaTeX[(("\text{\textcolor{#000099}{" * sort3) * "}}")], LaTeX[(("\text{\textcolor{#000099}{" * sort4) * "}}")], LaTeX[(("\text{\textcolor{#000099}{" * sort5) * "}}")], LaTeX[(("\text{\textcolor{#000099}{" * sort6) * "}}")], LaTeX[(("\text{\textcolor{#000099}{" * sort7) * "}}")], LaTeX[(("\text{\textcolor{#000099}{" * sort8) * "}}")], LaTeX[(("\text{\textcolor{#000099}{" * sort9) * "}}")], LaTeX[(("\text{\textcolor{#000099}{" * sort10) * "}}")], LaTeX[(("\text{\textcolor{#000099}{" * sort11) * "}}")], LaTeX[(("\text{\textcolor{#000099}{" * sort12) * "}}")]}}) → text13LaTeX("\text{Find the mean of the middle two numbers.}") → text14LaTeX((("\text{" * R1) * "}")) → Equaliservalue1Element(Asort, 1) → Asort1Element(Asort, 2) → Asort2Element(Asort, 5) → Asort5Element(Asort, 6) → Asort6Element(Asort, 7) → Asort7Element(Asort, 8) → Asort8Element(Asort, 9) → Asort9Element(Asort, 10) → Asort10Element(Asort, 11) → Asort11Element(Asort, 12) → Asort12LaTeX("\text{The third quartile is the mean or average of the middle two numbers in the upper half.}") → text22TableText({{LaTeX[(("\text{\textcolor{#000099}{" * sort1) * "}}")], LaTeX[(("\text{\textcolor{#000099}{" * sort2) * "}}")], LaTeX[(("\text{\textcolor{#000099}{" * sort3) * "}}")], LaTeX[(("\text{\textcolor{#000099}{" * sort4) * "}}")], LaTeX[(("\text{\textcolor{#000099}{" * sort5) * "}}")], LaTeX[(("\text{\textcolor{#000099}{" * sort6) * "}}")], LaTeX[(("\text{\textcolor{#000099}{" * sort7) * "}}")], LaTeX[(("\text{\textcolor{#000099}{" * sort8) * "}}")], LaTeX[(("\text{\textcolor{#000099}{" * sort9) * "}}")], LaTeX[(("\text{\textcolor{#000099}{" * sort10) * "}}")], LaTeX[(("\text{\textcolor{#000099}{" * sort11) * "}}")], LaTeX[(("\text{\textcolor{#000099}{" * sort12) * "}}")]}}) → text23LaTeX((((("\text{\textcolor{#000099}{Q₃=\frac{" * Asort9) * "+") * Asort10) * "}{2}}}")) → text16LaTeX((("\text{\textcolor{#000099}{Q₃=\frac{" * UAdd) * "}{2}}}")) → text17LaTeX((("\text{\textcolor{#000099}{Q₃=" * UDiv) * "}}")) → text24LaTeX((((("\text{\textcolor{#000099}{Q₁= \frac{" * Asort3) * "+") * Asort4) * "}{2}}}")) → text15LaTeX((("\text{\textcolor{#000099}{Q₁=\frac{" * LAdd) * "}{2}}}")) → text20LaTeX((("\text{\textcolor{#000099}{Q₁=" * LDiv) * "}}")) → text18LaTeX("\text{Lower half}") → text26LaTeX("\text{Lower half}") → text27LaTeX("\text{Upper half}") → text29LaTeX("\text{Upper half}") → text28LaTeX((("\text{The smallest number is \textcolor{#000099}{" * sort1) * "}.}")) → text4LaTeX("\text{The ordered list of numbers is as follows:}") → text8LaTeX((("\text{Cara recorded the number of miles she walked each day for \textcolor{#000099}{" * total) * "} days.Her data is listed below.Find the}")) → QuestionTextLaTeX("\text{Find the smallest number and use it as the first number in a new,ordered list.Cross it out in the original list. }") → text3LaTeX((("\text{Cross it out in the original list.The next number is \textcolor{#000099}{" * sort2) * "}.}")) → text6LaTeX("\text{Find \textcolor{#000099}{Q₁},the first quartile.}") → text11LaTeX("\text{The first quartile is the mean,or average,of the middle two numbers in the lower half.}") → text12LaTeX((("\text{\textcolor{#000099}{Q₁},the first quartile,is \textcolor{#000099}{" * LDiv) * "}}.")) → text19LaTeX((("\text{\textcolor{#000099}{Q₃},the third quartile,is \textcolor{#000099}{" * UDiv) * "}}.")) → text25LaTeX("\text{Find \textcolor{#000099}{Q₃},the third quartile.}") → text21LaTeX("\text{\mathbf{First\;quartile} the value that identifies the lower \textcolor{#000099}{25%} of the data;the median of the }") → text31LaTeX("\text{\mathbf{Third\; quartile} value that identifies the upper \textcolor{#000099}{25%} of the data;the median of the}") → text33LaTeX("\text{upper half of the data set;\textcolor{#000099}{75%} of all data is less than this value;written as \textcolor{#000099}{Q₃}.}") → text34LaTeX("\text{lower half of the data set;written as \textcolor{#000099}{Q₁}.}") → text32LaTeX("\text{values.The first six numbers are in the lower half and the last six numbers are in the upper half.}") → text10LaTeX("\text{Cara recorded the number of miles she walked for \textcolor{#000099}{12} days;therefore,the data set has an even number of }") → text30
AI 绘图提示语参考
绘制一组每日步行距离数据集的统计图,首先将数据按升序排序,然后找出第一、二、三、四分位数,并将这些值标注在图表中。接着,计算并显示数据的中位数和平均数。最后,将所有数据点和统计值清晰地展示在坐标系中,以便分析数据分布和趋势。
以上提示语为根据原始绘图命令整理而来,仅供参考。