
2011欧冠决赛精准传球分析
几何画板及绘图内容加载中,请稍等……
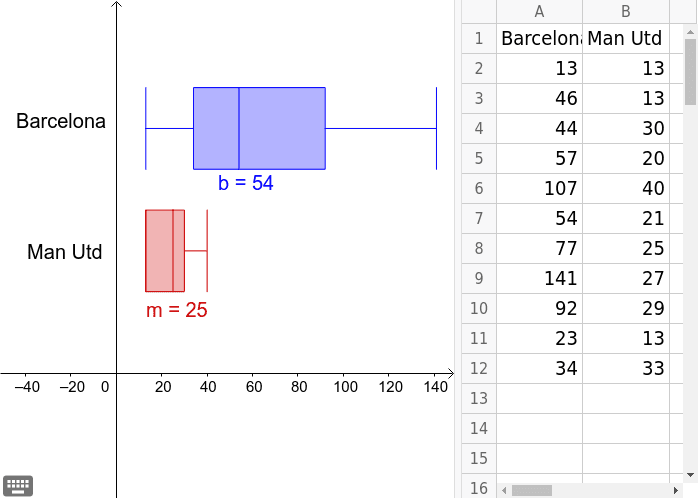
该范例通过分析2011年欧冠决赛中的精准传球,展示了统计学中的箱线图和饼图。通过GeoGebra命令BoxPlot和Text,构造了传球数据的统计分析。适合高中数学教学,特别是统计学和概率统计的教学。
GeoGebra 命令及参数
BoxPlot(1, 0.3333333333333333, {B2, B3, B4, B5, B6, B7, B8, B9, B10, B11, B12}, true) → mBoxPlot(2, 0.3333333333333333, {A2, A3, A4, A5, A6, A7, A8, A9, A10, A11, A12}, true) → bText(" Man Utd ") → text1Text(" Barcelona ") → text2