
直线函数的加法与减法练习
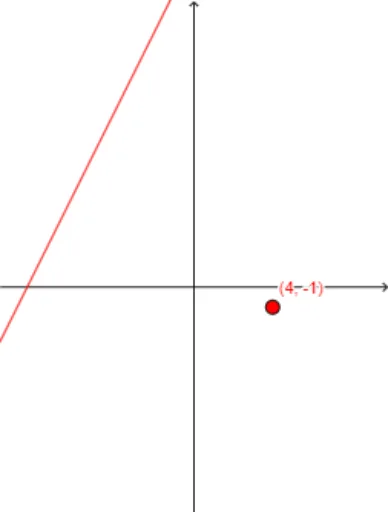
几何画板及绘图内容加载中,请稍等……
①本范例演示了如何通过 GeoGebra 绘制两条直线函数并展示它们的和与差;②涉及的核心数学概念包括函数加法、减法、线性函数的性质、函数图像的变换;③作图要点:使用了 Random, Textfield, RandomElement, Polygon, TableText, LaTeX 等命令和对象来生成随机直线函数并动态展示其加法和减法结果;④适合高中数学学生用于理解函数运算和图像变换,也可用于教学演示。
GeoGebra 命令及参数
Random(1, 5) → deltaxRandom(-10, 10) → d_1Textfield(g) → InputBox1RandomElement({-5, -4, -3, -2, -1, 1, 2, 3, 4, 5}) → a_1RandomElement({-5, -4, -3, -2, -1, 1, 2, 3, 4, 5}) → c_1Textfield(m) → InputBox2Polygon(B, C, D, E) → poly1, b_2, c_1, d_2, e_1TableText({{A3, B3, C3, D3}, {A4, B4, C4, D4}, {A5, B5, C5, D5}, {A6, B6, C6, D6}, {A7, B7, C7, D7}, {A8, B8, C8, D8}, {A9, B9, C9, D9}, {A10, B10, C10, D10}}, "|_r") → text1LaTeX(a, true, true) → text10LaTeX(b, true, true) → text11LaTeX(c, true, true) → text12LaTeX(d_1, true, true) → text13Random(1, 10) → nRand