
Weighted Average Rainfall via Voronoi Regions in Colorado
Loading the math board and drawing, please wait…
In collections
Voronoi Diagrams
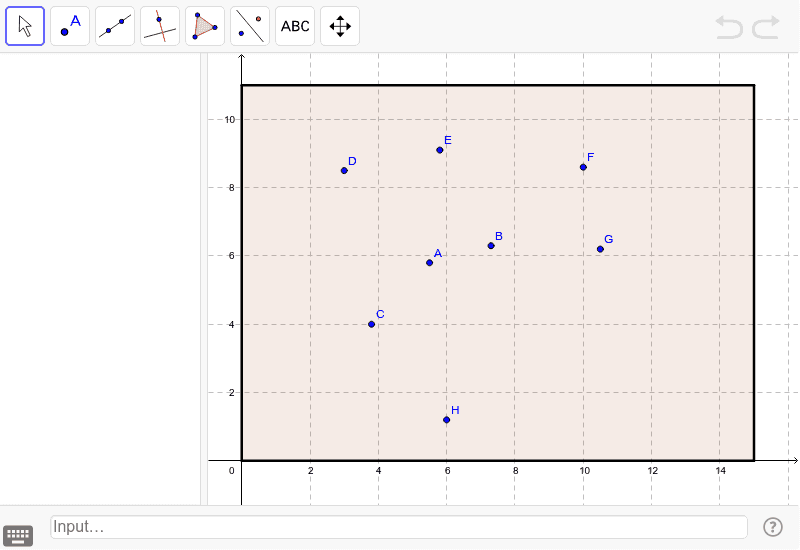
This example demonstrates calculating weighted average rainfall by plotting points and dividing the area into Voronoi regions. Key math concepts include weighted averaging, Voronoi partitioning, and geometric construction. Construction involves GeoGebra commands like Intersect and Polygon to create points, regions, and graphs. Suitable for high school students or college freshmen learning geometry and statistics applications.
GeoGebra Commands & Parameters
Intersect(xAxis, yAxis) → WPolygon(Y, X, Z, W) → poly1, V, S, z, a
AI Drawing Prompt Reference
Draw a plane with points representing locations. Divide these points into regions similar to Voronoi partitions. Calculate the average of points within each region, weighted by their importance. Then, plot these weighted averages on the graph to show the average rainfall in different areas.
The prompt above was compiled from the original drawing commands and is for reference only.