
Wealth Distribution Among Factors of Production
Loading the math board and drawing, please wait…
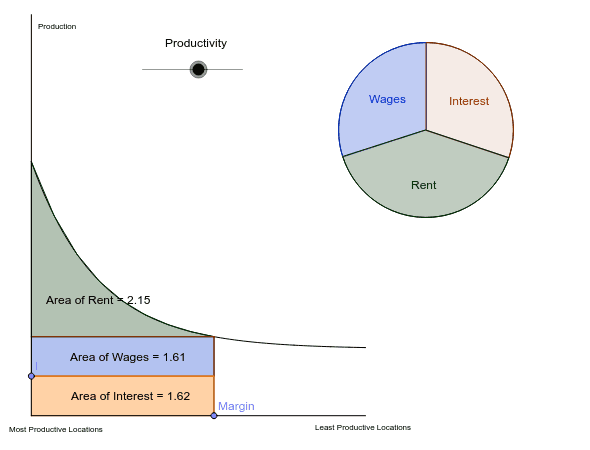
This example demonstrates the graphical phenomenon of changing proportions of rent in wealth distribution among factors of production as the economic pie grows. Core math concepts include distributions, triangles, cylinders, standard deviation, sequences and series, and inequalities. It is constructed using GeoGebra commands like Intersect, Point, If, Segment, Polygon, Circle, and Sector, focusing on geometric and algebraic modeling. Suitable for high school and above, ideal for teaching economic models and mathematical modeling.
GeoGebra Commands & Parameters
Intersect(xAxis, yAxis) → EPoint(Segment[(0, 0), (5, 0)]) → MarginIf(0 ≤ x ≤ 5, Productivity * ℯ^(-x) + 1) → fPoint(Segment[E, A]) → ISegment(Margin, C) → cSegment(C, A) → aIntersect(f, yAxis, (0, 3.8)) → DPolygon(D, A, C, (7 * x(Margin) / 8, f(7 * x(Margin) / 8)), (3 * x(Margin) / 4, f(3 * x(Margin) / 4)), (5 * x(Margin) / 8, f(5 * x(Margin) / 8)), (x(Margin) / 2, f(x(Margin) / 2)), (3 * x(Margin) / 8, f(3 * x(Margin) / 8)), (x(Margin) / 4, f(x(Margin) / 4)), (x(Margin) / 8, f(x(Margin) / 8))) → Rent, b, m, d, e, g, h, i, j, k, lPolygon(A, I, F, C) → Wages, n, p, q, rPolygon(E, Margin, F, I) → Capital, e_1, margin, f_1, b_1Circle(G, ((Rent + Wages + Capital) / π)^(0.5)) → sSector(s, 1.5707963267948966, π / 2 + Wages / (Rent + Wages + Capital) * 2 * π) → tSector(s, π / 2 - Capital / (Rent + Wages + Capital) * 2 * π, 1.5708) → c_1Segment((0, 0), (5, 0)) → a_1Segment((0, 0), (0, 6)) → g_1Sector(s, π / 2 + Wages / (Rent + Wages + Capital) * 2 * π, π / 2 - Capital / (Rent + Wages + Capital) * 2 * π + 1.0E-5) → d_1
AI Drawing Prompt Reference
Draw a graph showing the changing proportions of wealth distribution, including the intersection of coordinate axes, a horizontal segment from the origin to x=5, and a curve drawn based on an exponential function. The curve, y-axis, and horizontal segment enclose a polygon representing rent. Also include two polygons for wages and capital. Finally, use three sectors to represent the overall wealth distribution, with sizes and positions determined by the proportions of rent, wages, and capital.
The prompt above was compiled from the original drawing commands and is for reference only.