
Volumes generated by region between 2 curves
Loading the math board and drawing, please wait…
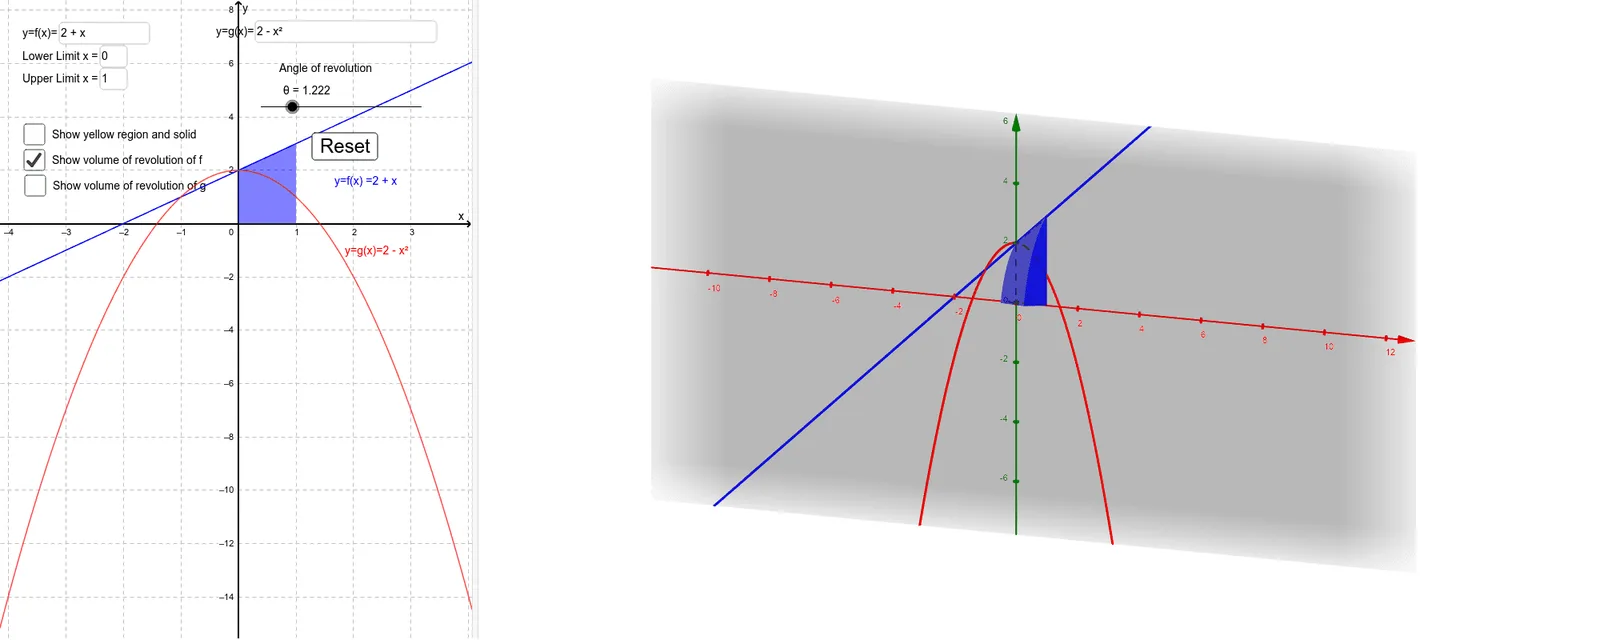
This example demonstrates the volume generated by rotating a region between two curves. It involves core math concepts like integration, volume calculation, function graphs, and rotational solids. Constructed using GeoGebra commands like Textfield, IntegralBetween, Surface, Integral, it allows parameter control via input boxes, volume calculation, and visualization of rotational bodies, making it suitable for high school and above students learning integral volume calculations and geometric applications of function graphs.
GeoGebra Commands & Parameters
Textfield(f) → inputBox1Textfield(upperlimit) → inputBox2Textfield(lowerlimit) → inputBox3IntegralBetween(f, g, ll, ul) → h_1Textfield(g) → InputBox1IntegralBetween(f, g, ll, ul) → AreabyDefiniteIntegralSurface(u, (f(u) * cos(v)), (f(u) * sin(v)), u, ll, ul, v, 0, θ) → CurvedSurfacefSurface(u, (g(u) * cos(v)), (g(u) * sin(v)), u, ll, ul, v, 0, θ) → CurvedSurfacegSurface(u, f(u) + (v * (g(u) - f(u))), 0, u, ll, ul, v, 0, 1) → FacexySurface(u, ((f(u) + (v * (g(u) - f(u)))) * cos(θ)), ((f(u) + (v * (g(u) - f(u)))) * sin(θ)), u, ll, ul, v, 0, 1) → FacerotateSurface(ll, (u * cos(v)), (u * sin(v)), u, Min[f(ll), g(ll)], Max[f(ll), g(ll)], v, 0, θ) → LLfaceSurface(ul, (u * cos(v)), (u * sin(v)), u, Min[f(ul), g(ul)], Max[f(ul), g(ul)], v, 0, θ) → ULfaceIntegral(f, ll, ul) → intfIntegral(g, ll, ul) → intgSurface(u, ((v * f(u)) * cos(θ)), ((v * f(u)) * sin(θ)), u, ll, ul, v, 0, 1) → FacerotatefSurface(u, ((v * g(u)) * cos(θ)), ((v * g(u)) * sin(θ)), u, ll, ul, v, 0, 1) → FacerotategSurface(u, (v * f(u)), 0, u, ll, ul, v, 0, 1) → FacexyfSurface(u, (v * g(u)), 0, u, ll, ul, v, 0, 1) → FacexygSurface(ll, (u * cos(v)), (u * sin(v)), u, 0, f(ll), v, 0, θ) → LLfacefSurface(ll, (u * cos(v)), (u * sin(v)), u, 0, g(ll), v, 0, θ) → LLfacegSurface(ul, (u * cos(v)), (u * sin(v)), u, 0, f(ul), v, 0, θ) → ULfacefSurface(ul, (u * cos(v)), (u * sin(v)), u, 0, g(ul), v, 0, θ) → ULfacegIntegral(f, ll, ul) → AreabyDefiniteIntegralfIntegral(g, ll, ul) → AreabyDefiniteIntegralg
AI Drawing Prompt Reference
Visualize the volume generated by rotating a region between two curves. Start by plotting two function graphs and marking the integral bounds. Calculate the area between the curves using integration and generate the surface of the solid of revolution. Include auxiliary surfaces formed by the function curves and bounds, as well as the lateral and base surfaces of the solid, to create a complete model that illustrates integral volume calculations and the geometric application of function graphs.
The prompt above was compiled from the original drawing commands and is for reference only.