
Visualizing Volumes of Revolution
Loading the math board and drawing, please wait…
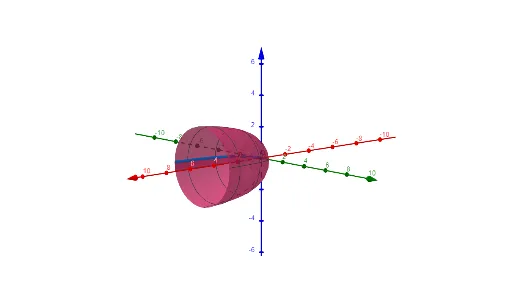
①This example dynamically displays the volume of a solid formed by rotating a planar figure around an axis, making the generation of revolution volumes intuitive. ②Core mathematical concepts include volume of revolution, definite integrals, centroid (barycenter), and geometric operations such as subtraction and congruence, involving triangles and their combinations. ③Construction highlights: the Surface command in GeoGebra is used to create the revolution surface, with an angle object (angle) controlling the rotation angle, and variables g and a adjusting shape parameters to observe volume changes dynamically. ④Suitable for high school to early college students, this serves as a teaching demonstration for calculus topics on volumes of revolution, and as a reference for teachers creating interactive lessons.
GeoGebra Commands & Parameters
Surface(g, angle, xAxis) → a
AI Drawing Prompt Reference
Create a 3D visualization of a solid formed by rotating a planar figure composed of triangles around a horizontal axis. The rotation angle is adjustable, and the shape parameters can be varied to change the triangle dimensions, dynamically altering the solid's volume. The surface should be smooth, with the axis clearly shown, and the overall view in perspective, suitable for demonstrating volume of revolution in calculus.
The prompt above was compiled from the original drawing commands and is for reference only.