
Visualizing Triangle Inequalities by user25677_1
Loading the math board and drawing, please wait…
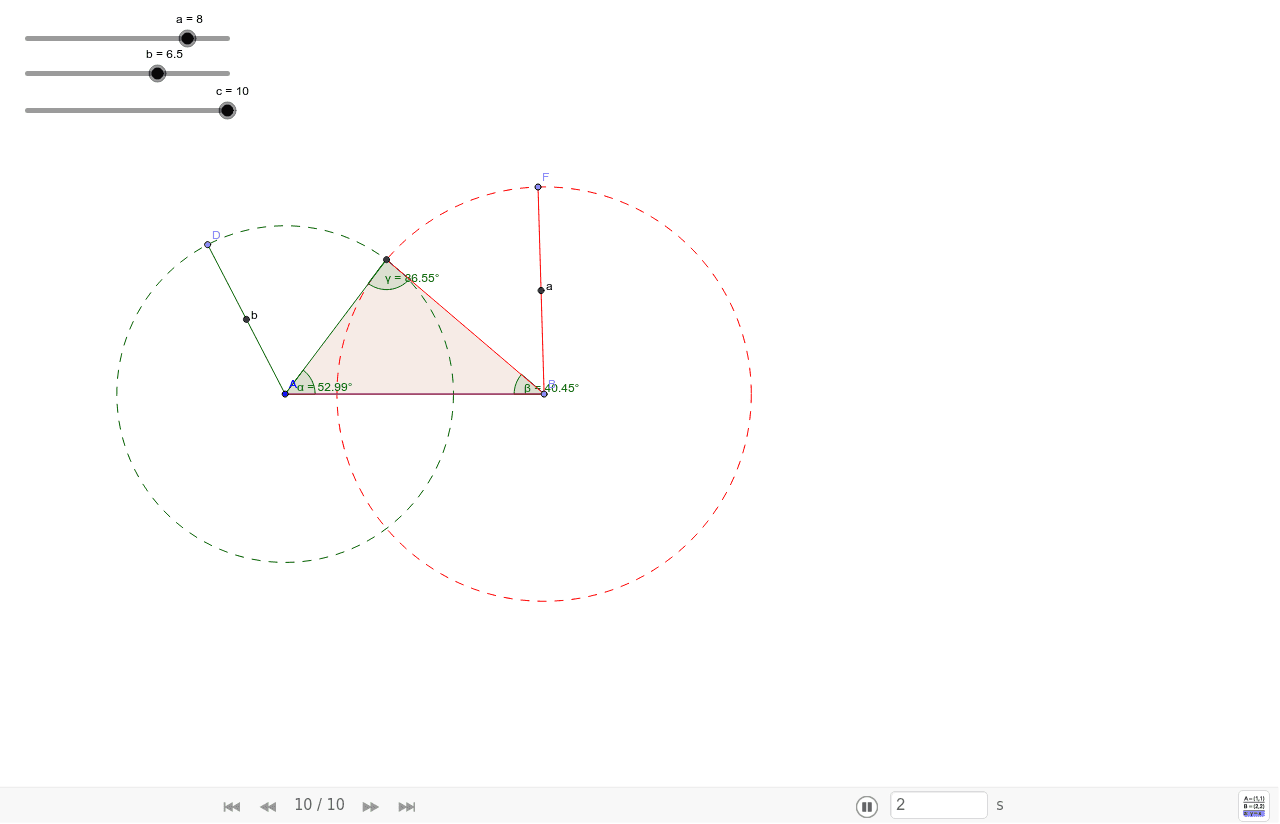
This example dynamically demonstrates the triangle inequality theorem by visualizing the relationships between the sides and angles of a triangle. Key math concepts include triangle inequalities, side-angle relationships, and geometric constructions. It utilizes GeoGebra commands and objects such as Point, Segment, Circle, Intersect, Polygon, Angle, and Midpoint. Suitable for middle school and above students to understand the criteria and geometric applications of triangle inequalities.
GeoGebra Commands & Parameters
Point(Circle[A, abs(c)]) → BSegment(A, B) → dCircle(A, b) → eCircle(B, a) → fIntersect(e, f, 1) → CPolygon(A, B, C) → poly1, c_1, a_1, b_1Angle(poly1) → α, β, γPoint(e) → DSegment(A, D) → gMidpoint(g) → EPoint(f) → FSegment(B, F) → hMidpoint(h) → G
AI Drawing Prompt Reference
Create a dynamic visualization of the triangle inequality theorem, showing a triangle with three vertices and sides, and labeling its three angles. Draw two circles centered at two vertices with radii equal to the other two sides, and mark their intersection point as the third vertex. Highlight the triangle's sides and angles, and draw lines from the vertices to the intersection points of the circles, finding the midpoints of these lines to illustrate the relationships between sides and angles in the geometric construction.
The prompt above was compiled from the original drawing commands and is for reference only.