
Visualizing Three-Set Operations with Venn Regions
Loading the math board and drawing, please wait…
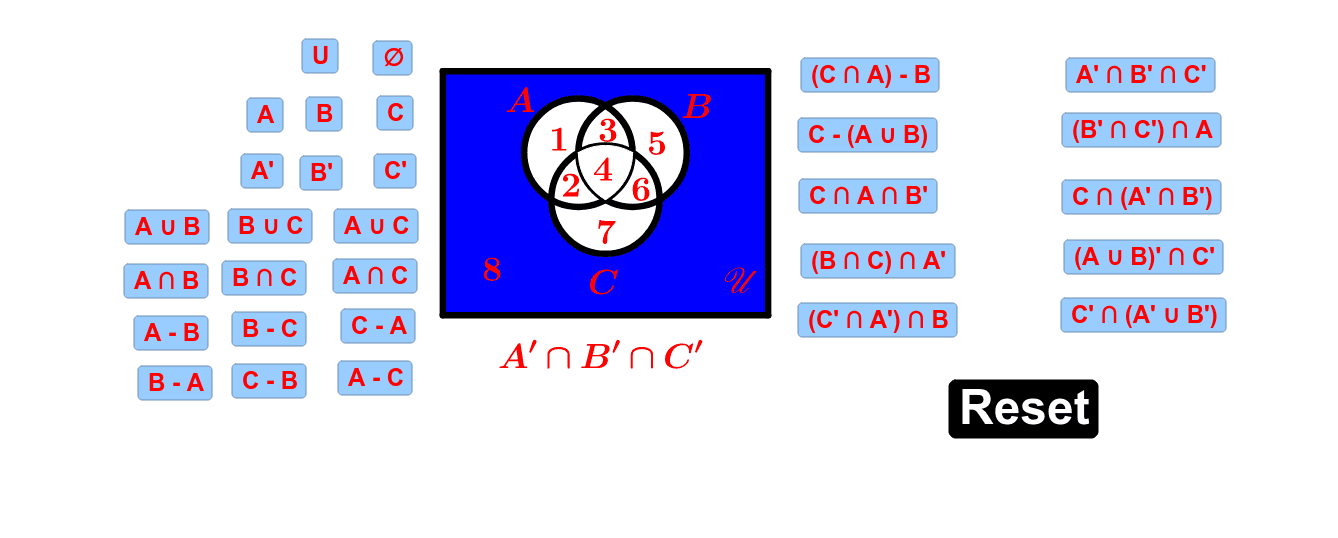
This example visualizes operations on three sets by using circles, sectors, and polygonal regions to show intersections, unions, complements, and the universal set. It connects set theory with Venn diagrams, region boundaries, probability events, and inequality-defined feasible areas. The construction uses Point to place centers and key intersections, Circle to draw set boundaries, Intersect to locate common points, CircleSector to fill sector regions, and Polygon and Segment to create polygonal outlines and line segments. Objects such as Universe, A, B, C, D, a, b, c, d, and CenterA label the universal set and individual regions. It is suitable for secondary mathematics lessons on sets and probability, as well as GeoGebra demonstrations of geometric construction and data visualization.
GeoGebra Commands & Parameters
Polygon(A, B, C, D) → Universe, a, b, c, dPoint(yAxis) → CenterACircle(CenterA, F) → CircleAPoint(CircleA) → CenterBCircle(CenterB, CenterA) → CircleBIntersect(CircleA, CircleB, 2) → CenterCCircle(CenterC, CenterA) → CircleCIntersect(CircleA, CircleB, 1) → ECircleSector(CenterA, CenterC, E) → AB1CircleSector(CenterB, E, CenterC) → AB2Intersect(CircleA, CircleC, 2) → GCircleSector(CenterA, G, CenterB) → AC1CircleSector(CenterC, CenterB, G) → AC2Intersect(CircleB, CircleC, 2) → HCircleSector(CenterC, H, CenterA) → BC1CircleSector(CenterB, CenterA, H) → BC2Circle(CenterA, F) → eCircle(CenterB, CenterA) → fCircle(CenterC, CenterA) → gSegment(A, B) → hSegment(B, C) → iSegment(C, D) → jSegment(D, A) → kCircleSector(CenterC, CenterB, CenterA) → ABC1CircleSector(CenterB, CenterA, CenterC) → ABC2CircleSector(CenterA, CenterC, CenterB) → ABC3
AI Drawing Prompt Reference
Draw a three-set operation diagram using three intersecting circles to represent sets, with sectors and polygonal regions to show intersections, unions, complements, and the universal set. Start by drawing a rectangle to represent the universal set, then place three intersecting circles inside. Mark the intersection points of the circles. Fill the intersecting areas with sectors and outline the regions with polygons and lines to illustrate the results of set operations.
The prompt above was compiled from the original drawing commands and is for reference only.