
Visualizing the Logarithm Change-of-Base Formula: log_b(x)=ln(x)/ln(b)
Loading the math board and drawing, please wait…
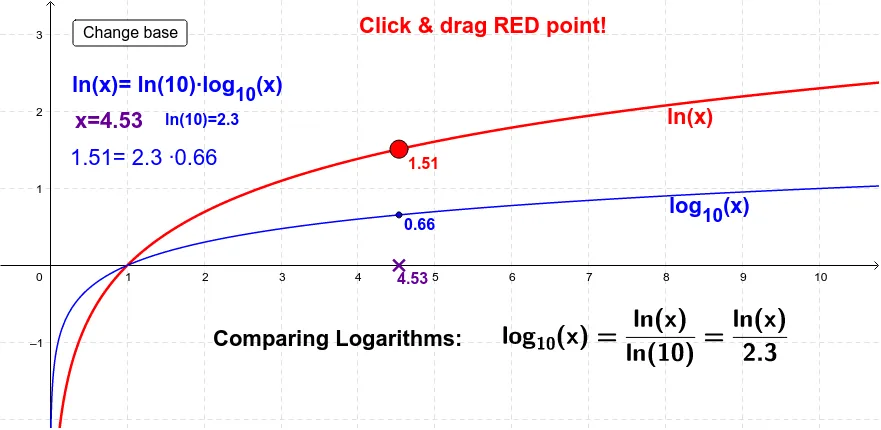
① This applet dynamically illustrates the change-of-base formula for logarithms, log_b(x)=ln(x)/ln(b), by showing how any logarithm can be expressed as a ratio of natural logarithms. ② The core mathematical concepts include logarithmic functions, the change-of-base identity, natural logarithms, and the behavior of function graphs. ③ Construction highlights: using GeoGebra's Point command to create key points, defining multiple function objects (f, g, h) and text objects (text1 through text18), and employing sliders (base, fak10, fak2) to adjust the base and scaling factors, thereby updating the graph and numerical values in real time to demonstrate the relationship between logarithms of different bases and the natural logarithm. ④ Suitable for high school and college students, this applet helps in understanding and verifying the change-of-base formula, and serves as an interactive tool for classroom demonstrations or self-directed exploration.
GeoGebra Commands & Parameters
Point(f) → A
AI Drawing Prompt Reference
Create a coordinate system with a natural logarithm curve and a logarithm curve with an adjustable base, linked by the change-of-base formula. Mark key points on the curves and display corresponding numerical expressions. Include sliders to adjust the base and scaling factors, updating the graph and values in real time to show that any logarithm equals the ratio of natural logarithms. The graphic should feature axes, grid, function curves, draggable sliders, and dynamic text labels, suitable for classroom demonstration.
The prompt above was compiled from the original drawing commands and is for reference only.