
Visualizing the Limit Definition of Derivative
Loading the math board and drawing, please wait…
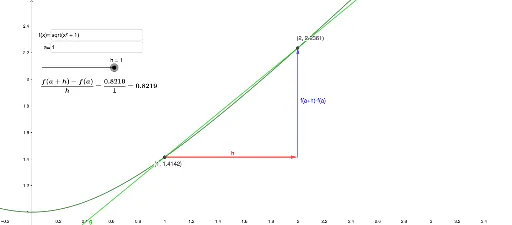
This GeoGebra example demonstrates the limit definition of derivative through dynamic geometric construction. It visualizes how the secant line at point A on a function curve approaches the tangent line as h approaches zero, intuitively showing the geometric meaning of derivative as a limit. Key commands used: Vector for representing difference quotients, Textfield for displaying limit expressions, Tangent for constructing tangent lines, and Line for drawing secant lines. Input boxes allow users to adjust parameter a and h, with sliders controlling h to dynamically observe the difference quotient approaching the tangent slope as h→0. Suitable for high school mathematics and introductory calculus courses.
GeoGebra Commands & Parameters
Vector(A, (x(B), y(A))) → uVector((x(B), y(A)), B) → vTextfield(f) → InputBox1Textfield(a) → InputBox2Tangent(A, f) → iLine(A, B) → g