
Visualizing Sine Function
Loading the math board and drawing, please wait…
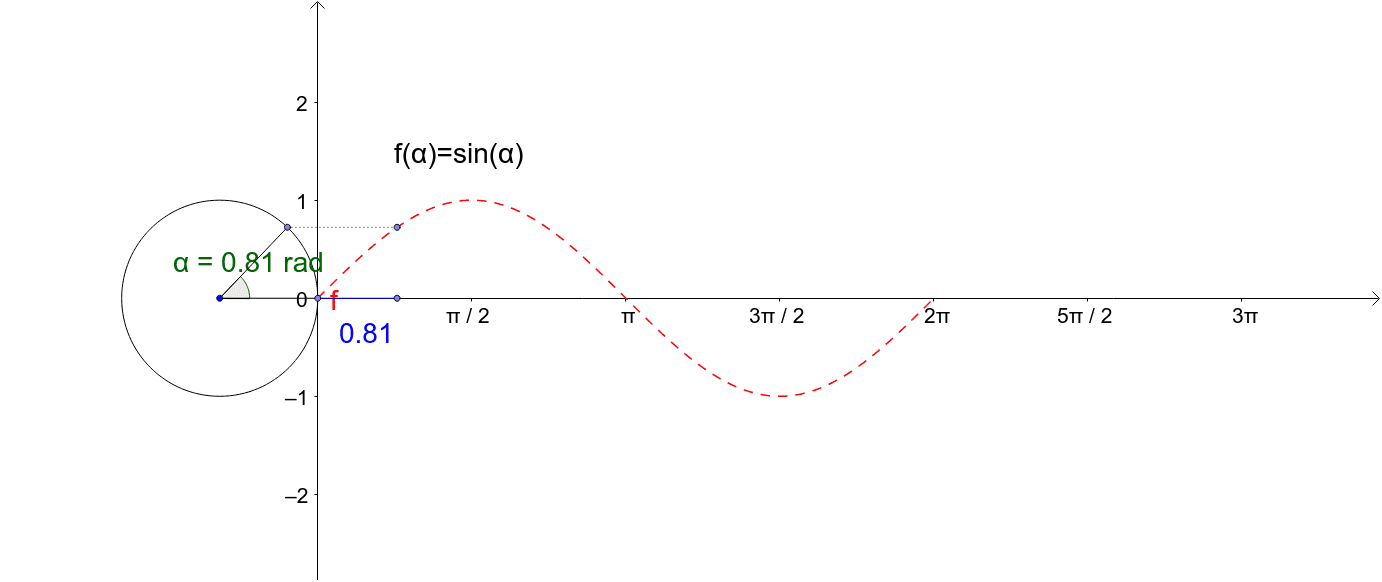
This example demonstrates the process of generating a sine function graph. By moving the angle, you can observe the graph being traced. Key mathematical concepts include the sine function and angles. It uses GeoGebra commands such as Point, Circle, Segment, Angle, and Function. Suitable for high school mathematics education and learning.
GeoGebra Commands & Parameters
Point(yAxis) → BCircle(A, B) → cSegment(B, A) → aPoint(c) → CAngle(B, A, C) → αSegment(A, C) → bFunction(sin(x), 0, 6.28) → fSegment(C, D) → dSegment(B, E) → e
AI Drawing Prompt Reference
Draw a sine function graph. Start by taking a point B on the y-axis, draw a circle c with center A and passing through B, draw a line segment a from B to A, take a point C on circle c, draw a line segment b from A to C to form angle α, draw the sine function graph f from 0 to 2π, draw a line segment d from C to another point D on circle c, and draw a line segment e from B to another point E on circle c.
The prompt above was compiled from the original drawing commands and is for reference only.