
Sine Function Basics
Loading the math board and drawing, please wait…
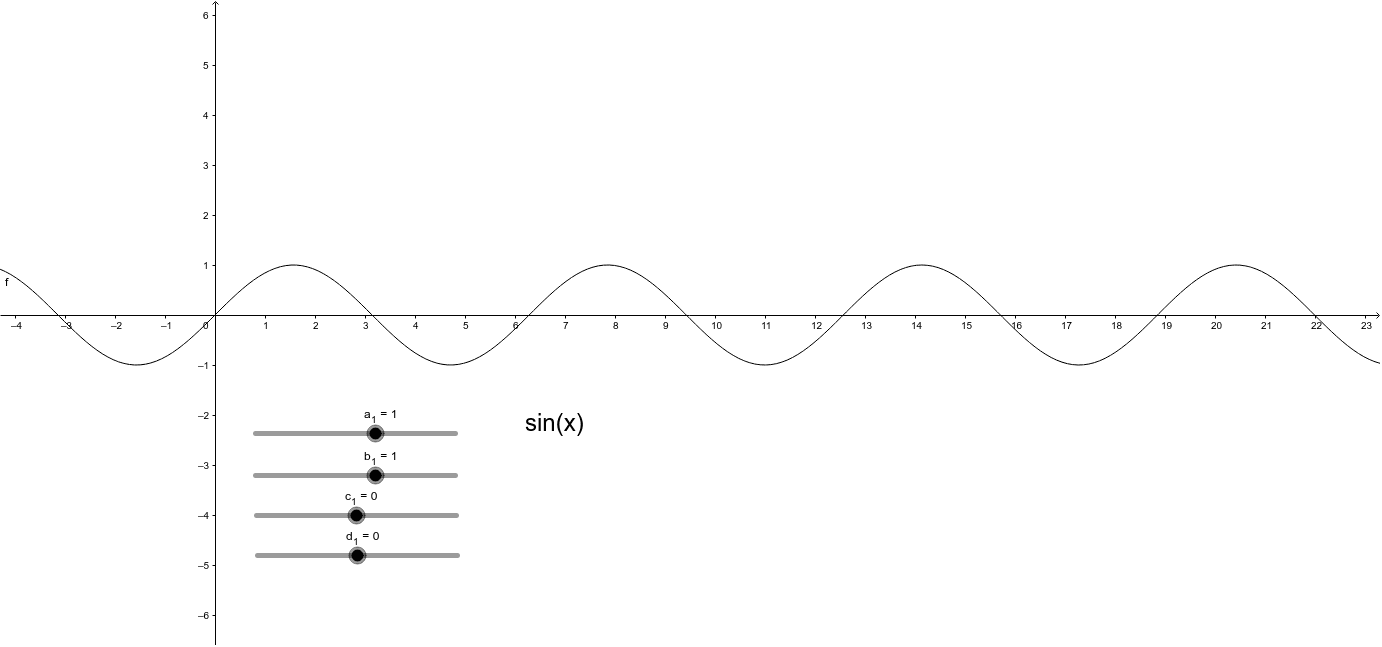
This example demonstrates the basic graph and properties of the sine function. Key mathematical concepts include periodicity, amplitude, and vertical/horizontal shifts. Construction uses GeoGebra commands like a_1, b_1, c_1, d_1, f, and text1. Suitable for middle or high school math learning to understand the fundamental graph and transformations of trigonometric functions.
GeoGebra Commands & Parameters
Numeric a_1(1.0)Numeric b_1(1.0)Numeric c_1(0.0)Numeric d_1(0.0)f(x) = (a_1 * sin((b_1 * x) - c_1)) + d_1
AI Drawing Prompt Reference
Draw a basic sine function graph. The graph should show a wave-shaped curve with a period of 2π and an amplitude of 1. The curve should not be shifted vertically or horizontally. It should start from the origin and rise and fall to form a complete wave. The graph should clearly illustrate the periodicity and amplitude of the sine function, suitable for math learning.
The prompt above was compiled from the original drawing commands and is for reference only.