
Visualizing Functions of Two Variables
Loading the math board and drawing, please wait…
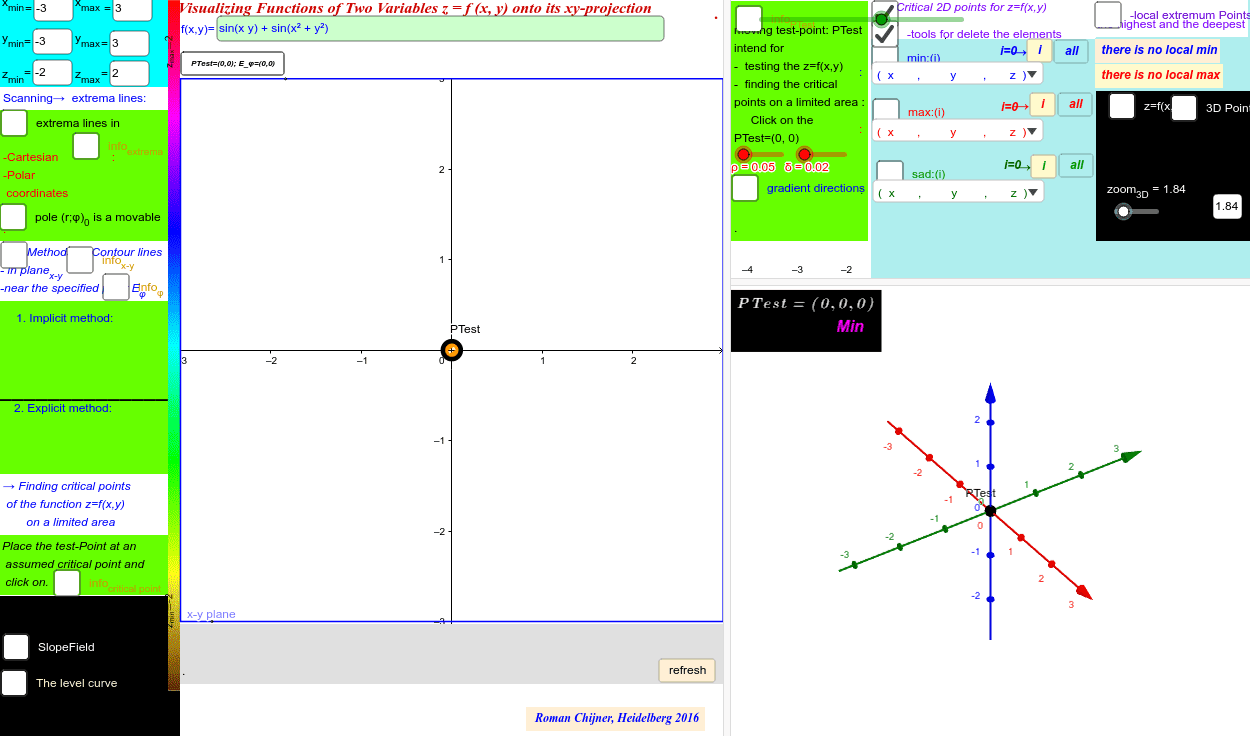
This example demonstrates the visualization of functions of two variables. Key mathematical concepts include functions, derivatives, and geometric construction. It uses commands like Polygon, ImplicitCurve, IntersectPath, etc. Suitable for high school and above students or teachers.
GeoGebra Commands & Parameters
Polygon((x_{max}, y_{max}), (x_{min}, y_{max}), (x_{min}, y_{min}), (x_{max}, y_{min})) → VV, j, t, c, dPolygon((x((ro; α)), y((ro; α)), z_{min}) + PTest, (x((ro; α + 180°)), y((ro; α + 180°)), z_{min}) + PTest, (x((ro; α + 180°)), y((ro; α + 180°)), z_{max}) + PTest, (x((ro; α)), y((ro; α)), z_{max}) + PTest) → poly1, k, l, m, pImplicitCurve(f(x, y) - f(x(C), y(C))) → ICurve_2IntersectPath(plane0, f(x, y)) → ICurve_3Point(ICurve_2) → R0Length(lr2) → llr2Sequence((x(Element[lr2, i]), y(Element[lr2, i]), f(x(Element[lr2, i]), y(Element[lr2, i]))), i, 1, llr2) → lllPmin01If(Length[lllPmin01] ≟ 0, false, true) → bwllPmin01Length(lr1) → llr1Sequence((x(Element[lr1, i]), y(Element[lr1, i]), f(x(Element[lr1, i]), y(Element[lr1, i]))), i, 1, llr1) → lllPmax01If(Length[lllPmax01] ≟ 0, false, true) → bwllPmax01If(bwllPmax01, Max[z(lllPmax01)], 1000) → Maxz0If(bwllPmax01, IndexOf[Maxz0, Sequence[z(Element[lllPmax01, i]), i, 1, Length[lllPmax01]]], 1000) → Indexmaxz0If(b, true, false) → hLength(lr3) → llr3Point(Segment[(0, 0), (6.28319, 0)]) → AfPoint(Segment[Px2, Px1]) → AxPoint(Segment[Py2, Py1]) → AyTextfield(N_{V1}) → inputBox1Textfield(x_{min}) → inputBox2Textfield(x_{max}) → inputBox3Textfield(y_{min}) → inputBox4Textfield(y_{max}) → inputBox5Textfield(f) → inputBox6Textfield(z_{min}) → inputBox7Textfield(z_{max}) → inputBox8Point(Segment[Pz2, Pz1]) → AzTextfield(ω_c) → inputBox9Textfield(vt) → inputBox10Sum(Sequence[If[f(x(PTest), y(PTest)) - f(x(Element[lr01, i]), y(Element[lr01, i])) > 0, 1, 0], i, 1, n]) → ext1RotateText("z_{min}=" + z_{min} + "", 90°) → Text2RotateText("z_{max}=" + z_{max} + "", 90°) → Text6Sequence(Segment[Element[l0maxmin2, k], Element[l0maxmin2, k + 1]], k, 1, Length[l0maxmin2]) → linelmaxmin2Sequence(Element[lr1, i], i, 1, llr1) → lPmaxSequence(Element[lr2, i], i, 1, llr2) → lPminSequence(Element[lr3, i], i, 1, llr3) → lPsadIf(bwllPmin01, Min[z(lllPmin01)], 1000) → Minz0If(bwllPmin01, IndexOf[Minz0, Sequence[z(Element[lllPmin01, i]), i, 1, Length[lllPmin01]]], 1000) → Indexminz0Element(lr2, Indexminz0) → P_{min0}If(bwllPmin01, Element[lllPmin01, Indexminz0], (1000, 1000, 1000)) → zmin2Point(Liste1) → C111aLocus(C1110a, C111a) → locPolyLine(l0maxmin1) → linelmaxmin11If(bwllPmax01, Element[lllPmax01, Indexmaxz0], (1000, 1000, 1000)) → zmax2RemoveUndefined(Sequence[If[f(x(PTest), y(PTest)) - f(x(Element[lr01, i]), y(Element[lr01, i])) > 0, i, NaN], i, 1, n]) → lr04Zip(Vector[b, a], a, Sequence[Element[lr01, Element[lr04, i]], i, 1, Length[lr04]], b, Sequence[Element[lr02, Element[lr04, i]], i, 1, Length[lr04]]) → lr06Sequence((x(Element[lr01, i]), y(Element[lr01, i]), f(x(Element[lr01, i]), y(Element[lr01, i]))), i, 1, n) → lr013Sequence((x(Element[lr02, i]), y(Element[lr02, i]), f(x(Element[lr02, i]), y(Element[lr02, i]))), i, 1, n) → lr023Zip(Vector[b, a], a, Sequence[Element[lr013, Element[lr04, i]], i, 1, Length[lr04]], b, Sequence[Element[lr023, Element[lr04, i]], i, 1, Length[lr04]]) → lr063Zip(Vector[a, b], a, Sequence[Element[lr01, Element[lr05, i]], i, 1, Length[lr05]], b, Sequence[Element[lr02, Element[lr05, i]], i, 1, Length[lr05]]) → lr07Zip(Vector[a, b], a, Sequence[Element[lr013, Element[lr05, i]], i, 1, Length[lr05]], b, Sequence[Element[lr023, Element[lr05, i]], i, 1, Length[lr05]]) → lr073Textfield(zoom_{3D}) → InputBox1Element(lr1, rmax - 1) → PzmaxElement(lr2, rmin - 1) → PzminElement(lr3, rsad - 1) → PzsadText("( x , y , z )") → TextR01Join({{TextR01}, lllPmax01}) → llPmax01Element(lr1, Indexmaxz0) → P_{max0}Sequence((x(Element[lr3, i]), y(Element[lr3, i]), f(x(Element[lr3, i]), y(Element[lr3, i]))), i, 1, llr3) → lllPspJoin({{TextR01}, lllPmin01}) → llPmin01Join({{TextR01}, lllPsp}) → llPsad01Element(lllPsp, rsad - 1) → Pzsad_{3D}Element(lllPmax01, rmax - 1) → Pzmax_{3D}Element(lllPmin01, rmin - 1) → Pzmin_{3D}Textfield(A) → InputBox2RemoveUndefined(Sequence[If[f(x(PTest), y(PTest)) - f(x(Element[lr01, i]), y(Element[lr01, i])) > 0, i, (-i)], i, 1, n]) → lr04cAppend(lr04c, Element[lr04c, 1]) → lr04ccSum(Sequence[If[(Element[lr04cc, i] * Element[lr04cc, i + 1]) < 0, 1, 0], i, 1, n + 1]) → lr04cccLine(A, RoR) → iImplicitCurve(f(x, y) - zi) → list3ImplicitCurve(f(x, y) - zii) → list4Vector(R0, R41) → w_11Vector(R0, R0 + R11) → u_11Textfield(ω0_c) → InputBox3Textfield(r_a) → InputBox5Point(c) → GPoint(j) → HPoint(w_11, 1) → IVector(F, I_{3D}) → vIf(ext1 ≟ n, 1, If[ext1 ≟ 0, 2, If[lr04ccc > 2 ∧ lr04ccc ≤ 4, 3, 4]]) → rooTextfield(n_c) → InputBox6Textfield(a_c) → InputBox7Textfield(r_{lc}) → InputBox8Textfield(vt) → InputBox9PolyLine(Bl) → BlyPolyLine(Gr) → GryPolyLine(Ro) → RoyTextfield(Nx) → InputBox10Textfield(Psize) → InputBox11Textfield(v_{m4}) → InputBox4
AI Drawing Prompt Reference
Draw a 3D function graph with the function expression f(x, y), where x ranges from x_{min} to x_{max} and y ranges from y_{min} to y_{max}. First, draw a quadrilateral as the base. Then, draw the surface of the function between z_{min} and z_{max}. Next, draw the intersection lines of the function with the planes at z_{min} and z_{max}, and find the highest and lowest points on these lines. Finally, draw the lines connecting these points.
The prompt above was compiled from the original drawing commands and is for reference only.