
Visualizing Finite and Infinite Limits
Loading the math board and drawing, please wait…
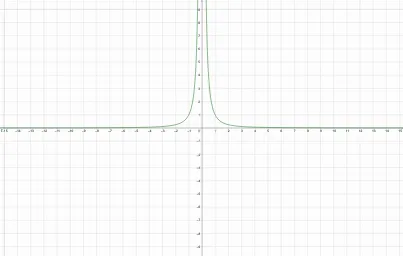
This example visualizes the approach behavior of a function for both finite limits and infinite limits, making it easier to see what happens as the independent variable approaches a point or grows without bound. It focuses on key calculus ideas: the distinction between limits that converge to a specific real value and limits that diverge to infinity (or negative infinity), along with the corresponding geometric behavior of the function’s graph near critical locations. Construction-wise, the GeoGebra model uses objects f, g, h, and p: f/g/h represent the relevant functions (curves or possibly 3D surfaces depending on the setup), while p serves as an auxiliary object to position the viewpoint/region and highlight the limit scenario. By coordinating these objects, the visualization emphasizes how the graph values change along the chosen approach, enabling a direct finite-vs-infinite comparison. Suitable for upper-secondary advanced study and early university calculus, especially for classroom demonstrations and conceptual review.
GeoGebra Commands & Parameters
f(x) = 1 / x^(2)g(x) = (x^(3) - 1) / (x^(2) - 1)h(x) = (x^(2) + x + 1) / (x + 1)p(x) = 1 / sqrt(1 - x^(2))
AI Drawing Prompt Reference
Plot the functions f(x) = 1 / x^2, g(x) = (x^3 - 1) / (x^2 - 1), h(x) = (x^2 + x + 1) / (x + 1), and p(x) = 1 / sqrt(1 - x^2). Observe the behavior of these functions as they approach specific points and as x grows without bound, particularly the distinction between finite and infinite limits. Start with f(x), then add g(x) and h(x), and finally p(x) to show the graph changes as they approach critical points.
The prompt above was compiled from the original drawing commands and is for reference only.