
Visualizing Equivalence Relation: Example 1
Loading the math board and drawing, please wait…
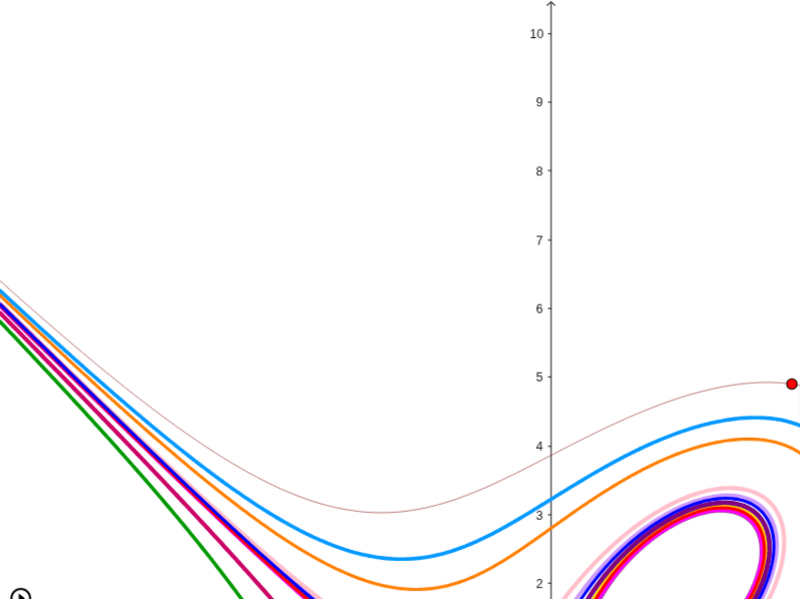
This example uses GeoGebra to demonstrate the concept of an equivalence relation. An equivalence relation is a binary relation on a set that is reflexive, symmetric, and transitive. By constructing various objects such as points, line segments, and polygons, the equivalence classes are illustrated. The construction involves points, line segments, polygons, and text objects. Suitable for high school mathematics education to help students understand the properties of equivalence relations.
GeoGebra Commands & Parameters
Numeric a(3.5)Numeric b(4.9)c: x^(3) + y^(3) - (6 * (y * x)) = a^(3) + b^(3) - ((6 * a) * b)Implicitpoly dImplicitpoly eImplicitpoly fImplicitpoly gImplicitpoly hImplicitpoly iImplicitpoly jImplicitpoly kImplicitpoly lImplicitpoly mImplicitpoly nImplicitpoly oPoint B(6.9, 2.6476086956521705)Point C(19.43, 2.6476086956521705)Point D(4.625, -0.5147826086956524)Point E(17.155, -0.5147826086956524)(a, b)Point F(6.96, 4.29)Point G(14.24, 4.274456521739131)Point H(-5.36, 5.15)Point I(6.44, 5.155217391304348)Point J(-3.355, 8.14866847826087)Point K(4.98, 8.098152173913045)
AI Drawing Prompt Reference
Draw the implicit function graph of the equation x^3 + y^3 - 6xy = 3.5^3 + 4.9^3 - 6*3.5*4.9, then add key points B(6.9, 2.65), C(19.43, 2.65), D(4.63, -0.51), E(17.16, -0.51), and F(6.96, 4.3), and finally draw line segments between these points to illustrate the properties of equivalence relations.
The prompt above was compiled from the original drawing commands and is for reference only.