
Visualize Fraction Concept
Loading the math board and drawing, please wait…
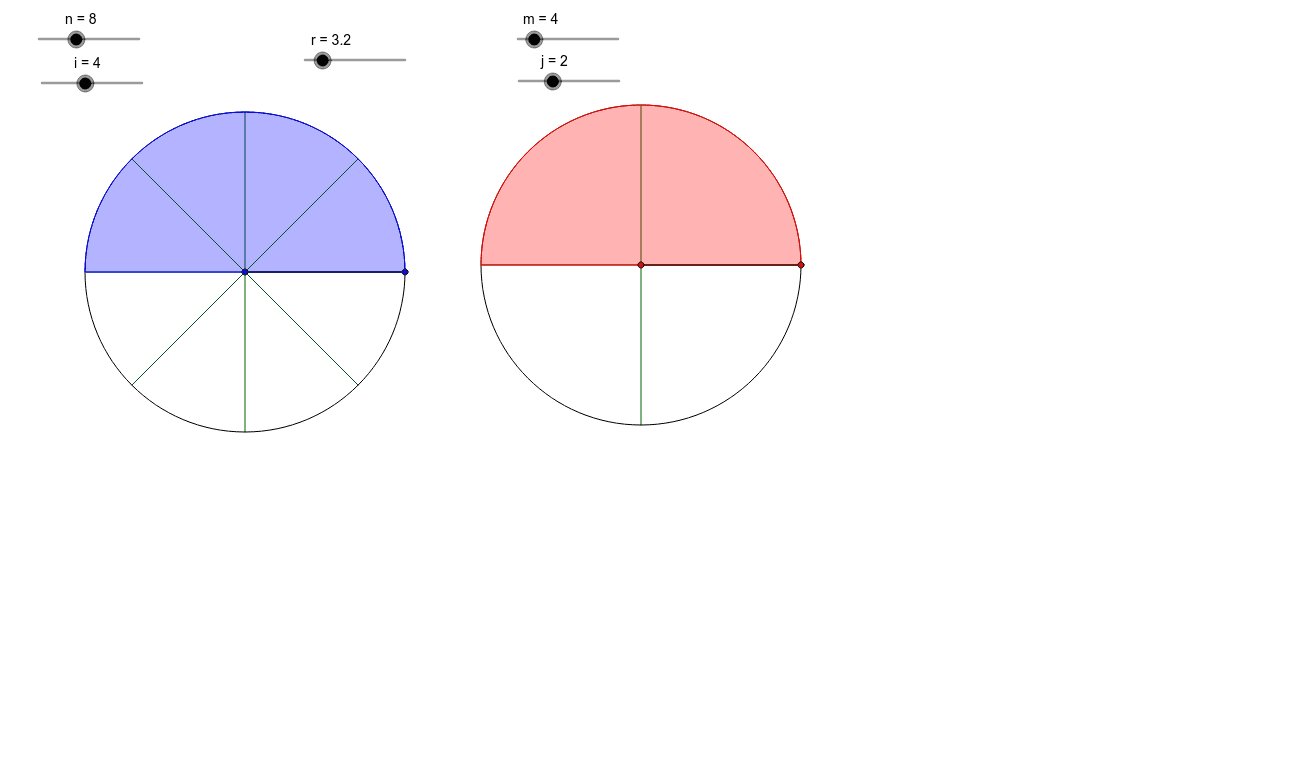
This example demonstrates the concept of fractions through dynamic visualization, aiding students in better understanding the meaning of fractions. It involves core mathematical concepts such as fractions, ratios, and the area relationships of geometric figures. The construction utilizes GeoGebra commands like Circle, Point, Segment, Append, CircleSector, Zip, ListP, Shade, etc. It is suitable for middle school mathematics education, explaining the geometric representation of fractions and their proportional relationships.
GeoGebra Commands & Parameters
Circle(A, r) → cPoint(c) → BSegment(A, B) → aAppend(Sequence[Rotate[B, i, A], i, (360 / n)°, 359.9*°, (360 / n)°], Rotate[B, 359.99*°, A]) → ListPCircleSector(A, B, Element[ListP, i]) → ShadeCircle(C, r) → dPoint(d) → DAppend(Sequence[Rotate[D, s, C], s, (360 / m)°, 359.9*°, (360 / m)°], Rotate[D, 359.99*°, C]) → ListP2CircleSector(C, D, Element[ListP2, j]) → Shade2Segment(C, D) → bZip(Segment[C, W], W, ListP2) → ListS2Zip(Segment[A, Z], Z, ListP) → ListS