
Vertical Line Test
Loading the math board and drawing, please wait…
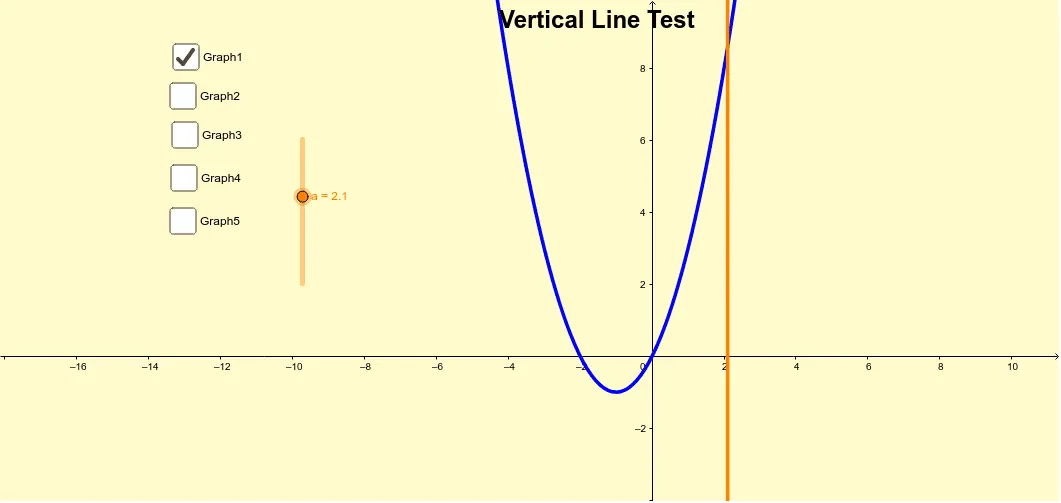
This example demonstrates how to determine if a graph represents a function using the vertical line test. Core math concepts include function definition and the principle of the vertical line test. Construction highlights involve GeoGebra commands/objects like Textfield, a, b, f, c, inputBox3, d, text1, e, h, p, g, i, j, k, q, l. Suitable for high school mathematics teaching on function graphs and properties.
GeoGebra Commands & Parameters
Textfield(c) → inputBox3
AI Drawing Prompt Reference
Draw a coordinate system and plot two vertical lines to demonstrate how to use the vertical line test to determine if a graph represents a function. Include an input box for entering a function expression and plot the corresponding function graph in the coordinate system based on the input.
The prompt above was compiled from the original drawing commands and is for reference only.