
Venn Diagram Calculator
Loading the math board and drawing, please wait…
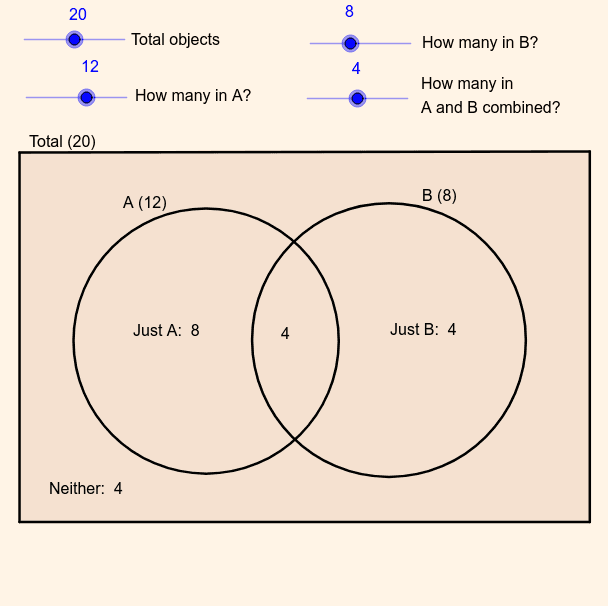
This example demonstrates the distribution of elements in a simple Venn diagram. Key mathematical concepts include set theory operations such as intersection, union, and complement. Using GeoGebra commands like Circle and Polygon, users can dynamically adjust the element distribution. Suitable for students in middle school and above to learn basic set operations.
GeoGebra Commands & Parameters
Circle(A, B) → c_1Circle(C, D) → dPolygon(E, F, G, H) → poly1, e, f, g, h
AI Drawing Prompt Reference
Draw a simple Venn diagram with two overlapping circles and a quadrilateral below, representing set operations like intersection, union, and complement. Start by sketching the two intersecting circles, then add the quadrilateral below to clearly illustrate the relationships between sets.
The prompt above was compiled from the original drawing commands and is for reference only.