
Using Equations for Lines: Grade 8 Interactive Lesson
Loading the math board and drawing, please wait…
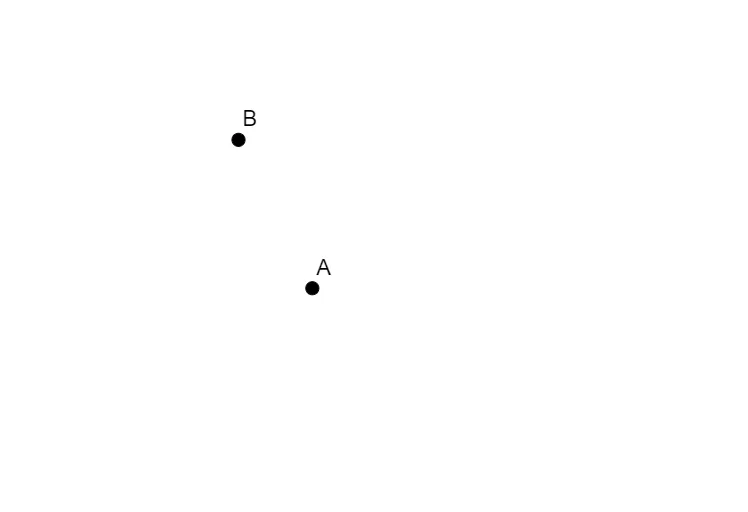
This GeoGebra example demonstrates how to represent a straight line algebraically by using two points A and B on the line. It focuses on the core mathematical concepts of linear functions and coordinate geometry, particularly the meaning of slope and intercept in a linear equation. The construction is simple: two free points A and B are created, and the line through them is automatically displayed, allowing students to observe how changing the points affects the equation. This lesson is designed for middle school students (around grade 8, ages 13-14) to bridge visual geometry and symbolic algebra, reinforcing the relationship between points, slope, intercept, and the equation of a line. It is also useful for introducing function graphing and preparing for systems of linear equations.
GeoGebra Commands & Parameters
Point A(-7.906484727212655, 1.1686653949068015)Point B(-10.311198464553016, 6.000994905181223)
AI Drawing Prompt Reference
Draw a line passing through points A at (-7.9, 1.2) and B at (-10.3, 6.0). Observe how changing the position of the points affects the line's equation, paying attention to the slope and y-intercept.
The prompt above was compiled from the original drawing commands and is for reference only.