
Unit Circle and Trig Graphs by Kay Kumar
Loading the math board and drawing, please wait…
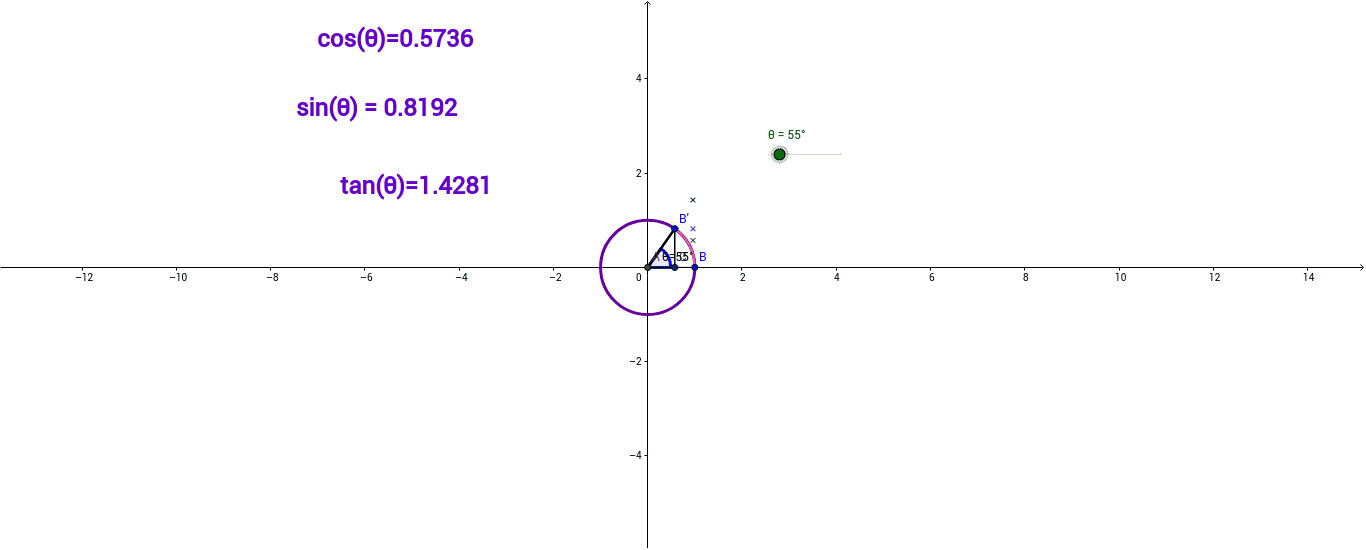
This example demonstrates the relationship between the unit circle and three basic trigonometric function graphs: sine, cosine, and tangent. Key math concepts include the unit circle, trigonometric function definitions, and the correspondence between angles and coordinates. GeoGebra commands used in the construction are Intersect, Rotate, OrthogonalLine, Segment, CircleArc, and Angle, along with objects like points, angles, and lines. It is suitable for high school mathematics education, providing an intuitive understanding of how trigonometric graphs are generated and their properties.
GeoGebra Commands & Parameters
Intersect(xAxis, yAxis) → ARotate(B, θ, A) → B'OrthogonalLine(B', xAxis) → aIntersect(a, xAxis) → CSegment(A, B') → bSegment(A, C) → dSegment(A, C) → eSegment(C, B) → fSegment(B', C) → gCircleArc(A, B, B') → hAngle(B, A, B') → α
AI Drawing Prompt Reference
Draw a unit circle with a central point and label the angle at the center. Draw a vertical line from the center to the x-axis, marking the origin. Select a point on the circle, draw a line from the center to this point, and rotate the point to align with the x-axis, noting the rotation angle. Draw a perpendicular line from the rotated point to the x-axis. Connect the origin to the rotated point and draw an arc. Finally, connect the origin to the foot of the perpendicular and the foot of the perpendicular to the rotated point, forming multiple line segments to illustrate the relationship between the unit circle and the graphs of sine, cosine, and tangent functions.
The prompt above was compiled from the original drawing commands and is for reference only.