
Unit Circle and Trig Functions with Different Parameters
Loading the math board and drawing, please wait…
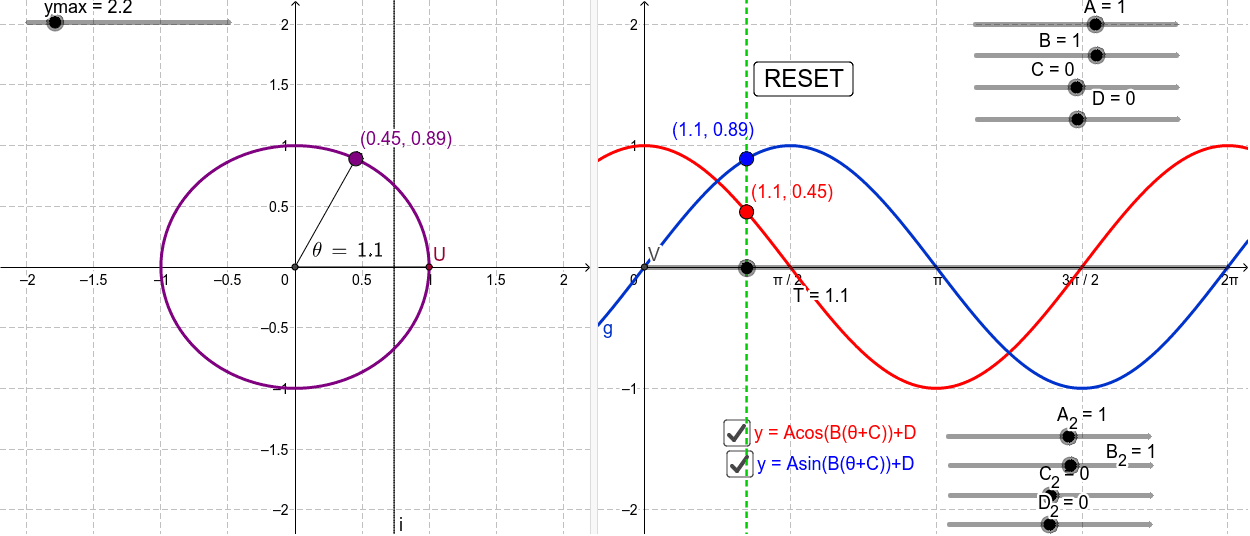
This example demonstrates the relationship between the unit circle and trigonometric functions (sine, cosine) under varying parameter settings. It involves core mathematical concepts such as the unit circle, trigonometric functions, and parameter variations. The construction utilizes GeoGebra commands like Intersect (intersection), CurveCartesian (Cartesian curve), Point (point), Segment (segment), LineBisector (angle bisector), and LaTeX (formula display). It is suitable for high school mathematics education, helping students understand the connection between trigonometric function graphs and the unit circle, as well as the impact of parameters on function graphs.
GeoGebra Commands & Parameters
Intersect(zAxis, xOyPlane) → A_1CurveCartesian(h(t), g(t), t, 0, 6.283185307179586) → fPoint(f) → ESegment(E, H) → eLineBisector(E, H) → jIntersect(j, f) → F, G, F_4, F_5, F_6, F_7, F_8, F_9, F_{10}, F_{11}, F_{12}, F_{13}, I, F_{14}, F_{15}, F_{16}, F_{17}, F_{18}, F_{19}, F_{20}, F_{21}, F_{22}, F_{23}, L, F_{24}, F_{25}, M, N, O, F_1, F_2, F_3Point(f) → PSegment(F, P) → kLineBisector(F, P) → lIntersect(j, l) → QIntersect(m, f) → R, S, T_1Point(f) → ULaTeX(θ, true, true) → text1Intersect(g, yAxis, (0, 0)) → VName(T) → A1_1Name(T) → A1Segment(H, A_1) → bSegment(U, A_1) → n
AI Drawing Prompt Reference
Draw a unit circle and sine and cosine function graphs to show their relationship. First, plot the intersection point of the unit circle and coordinate axes, then draw parametric curves for sine and cosine functions. Mark key points on the graphs. Next, draw line segments from points on the unit circle to the function graphs and find their intersections. Finally, draw angle bisectors and locate their intersections, while displaying the angle parameter formula.
The prompt above was compiled from the original drawing commands and is for reference only.