
Unit Circle and Graphs of Sin, Cos & Tan by Silvia
Loading the math board and drawing, please wait…
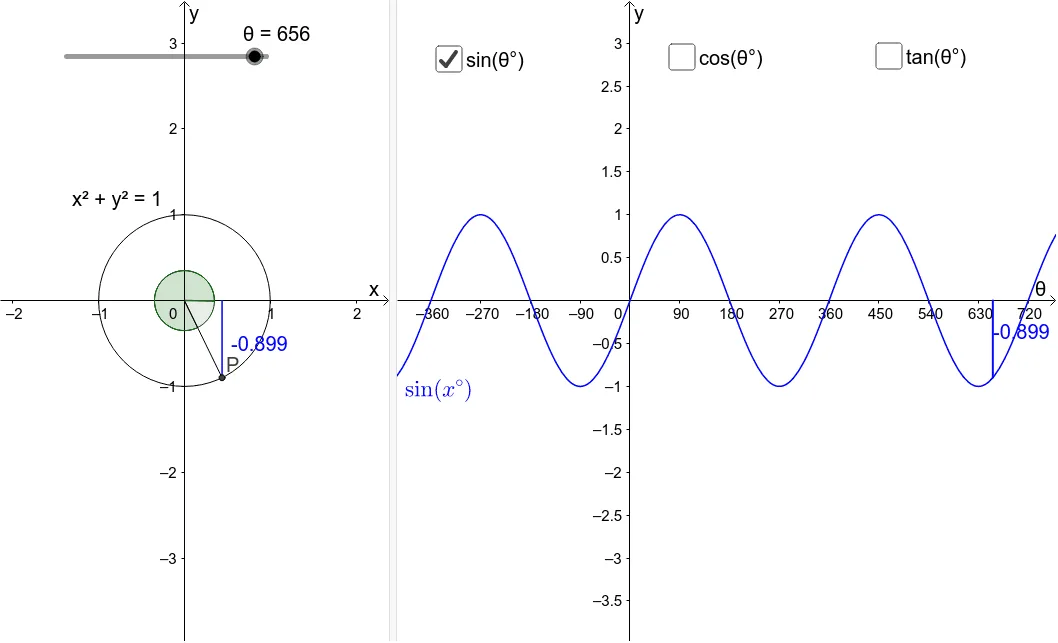
This example dynamically demonstrates the relationship between the coordinates of point P on the unit circle and the values of sinθ, cosθ, tanθ, visually presenting the definition of trigonometric functions. It involves core concepts like the unit circle, trigonometric function definitions, coordinate geometry, and function graphs. GeoGebra commands and objects used in construction include Intersect, Rotate, Angle, Segment, Midpoint, Tangent, along with circle, θ, A, B, P, etc. Suitable for high school students to understand the connection between trigonometric function graphs and the unit circle, or for introductory calculus teaching.
GeoGebra Commands & Parameters
Intersect(circle, xAxis, 2) → AIntersect(xAxis, yAxis) → BRotate(A, θ°, B) → PAngle(A, B, P) → αAngle(P, B, A) → βRotate(A, 359.9*°, B) → A'Angle(A, B, A') → γRotate(A, 359.9*°, B) → A'_1Rotate(A, 359.9*°, B) → A'_2Angle(A, B, A'_2) → δRotate(A, 359.9*°, B) → A'_3Angle(A, B, A'_3) → εSegment((x(P), 0), P) → aSegment(B, P) → bSegment((θ, 0), (θ, y(P))) → dMidpoint(C, P) → DMidpoint(E, F) → GSegment(B, C) → eMidpoint(B, C) → HSegment(E, I) → hMidpoint(E, I) → JTangent(P, circle) → k,Intersect(k, xAxis) → KSegment(P, K) → lMidpoint(K, P) → LSegment(E, M) → mMidpoint(M, E) → N
AI Drawing Prompt Reference
Draw a unit circle centered at the origin, intersecting the positive x-axis at a point. Rotate this point around the center by a variable angle θ to obtain a point P on the circle. Connect the center to P, and draw perpendicular segments from P to the x-axis and from the θ-position on the x-axis to P, illustrating sine and cosine values. Also draw the tangent line to the circle at P, intersecting the x-axis at another point, and connect P to that intersection to show the tangent value. Label the angle θ on the circle, and plot the graphs of sine, cosine, and tangent as functions of θ, linking points on the circle to corresponding points on the graphs with dashed lines to visually demonstrate the definitions of trigonometric functions.
The prompt above was compiled from the original drawing commands and is for reference only.