
Unit Circle and Cosine Graph by Althea Gallaway
Loading the math board and drawing, please wait…
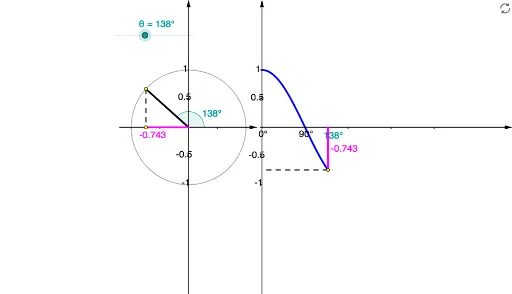
Generate the cosine graph using the unit circle. This example demonstrates how to use points on the unit circle to draw the cosine function graph. Key mathematical concepts include trigonometry and the unit circle. GeoGebra commands used include Point, Rotate, Angle, Segment, Circle, Vector, Sequence, and Function. Suitable for high school mathematics education and learning.
GeoGebra Commands & Parameters
Point(Ray[(0, 0), (-1, 0)]) → BRotate(A, θ, B) → PRotate(A, θ, B) → A'Angle(A, B, A') → αRotate(A, θ, B) → A'_1Angle(A, B, A'_1) → βSegment(Q, (x(Q), 0)) → eSegment((0, 0), (x(Q), 0)) → gCircle(B, A) → cSegment(B, P) → aVector((x(B), y(Corner[1])), (x(B), y(Corner[4]))) → uVector((0, y(Corner[1])), (0, y(Corner[4]))) → wVector((0, 0), (x(Corner[2]), 0)) → zSequence(Segment[((0.75 * i), 0), ((0.75 * i), -0.025)], i, 1, 4) → list1Segment(B, (x(P), 0)) → bSegment(P, (x(P), 0)) → hFunction(cos((120° * x)), 0, x(Q)) → fVector(B - (1.2, 0), B + (1.2, 0)) → vSequence(Segment[(0, (0.5 * i) - 1), (-0.025, (0.5 * i) - 1)], i, 0, 4) → list2Sequence(Segment[(x(B), (0.5 * i) - 1), (x(B) - 0.025, (0.5 * i) - 1)], i, 0, 4) → list3Sequence(Segment[B + ((0.5 * i) - 1, 0), B + ((0.5 * i) - 1, -0.025)], i, 0, 4) → list4Segment(Q, (0, y(Q))) → dPoint(Ray[(0, 0), (-1, 0)]) → B_1Rotate(A_1, θ, B_1) → P_1Rotate(A_1, θ, B_1) → A'_2Rotate(A_1, θ, B_1) → A'_3Circle(B_1, A_1) → c_1Segment(B_1, P_1) → a_1
AI Drawing Prompt Reference
Draw a unit circle and a cosine function graph, showing how to plot the cosine function using points on the unit circle. Start by drawing a unit circle, then rotate a point from the circle to create several points, connecting them to form the cosine curve. Also, draw vertical lines from the points on the circle to the x-axis, and plot the cosine function. Add some helper lines and markings to make the graph clearer.
The prompt above was compiled from the original drawing commands and is for reference only.