
Union and Intersection of Sets Using Venn Diagram
Loading the math board and drawing, please wait…
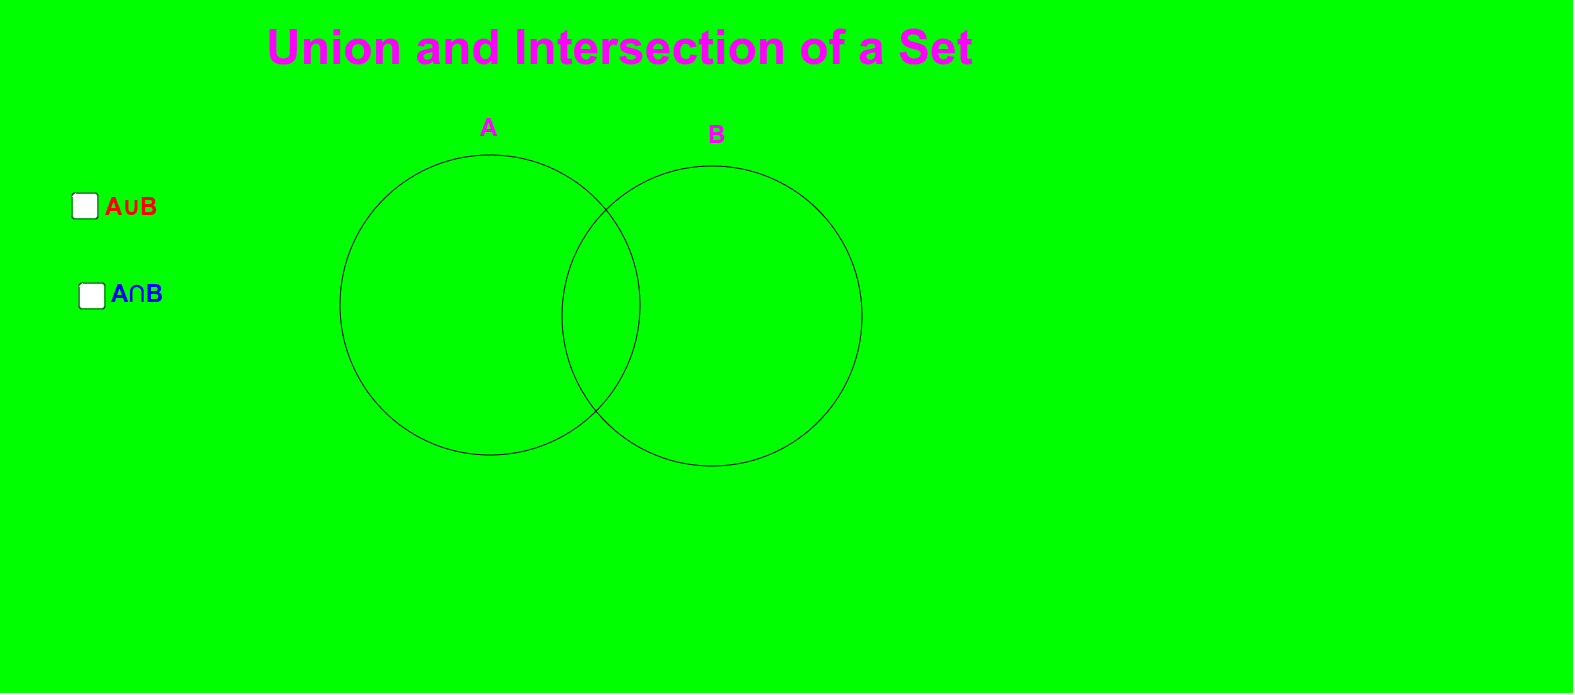
① This example demonstrates the union and intersection of two sets using a Venn diagram, where circular regions represent sets and the overlapping or combined areas are highlighted. ② The core mathematical concepts are set theory operations: union (∪) and intersection (∩), along with the visual partitioning of regions. ③ Construction details: from the construction summary, it uses GeoGebra commands such as Circle to create two circles (objects A and B), Intersect to find their intersection points (C and D), and CircleArc to draw arcs forming the Venn diagram boundaries; text objects (text1 to text5) label set names and operation results, with auxiliary segments (a, b) and special points (e, f, g, h) possibly aiding explanation. ④ Suitable for middle school (junior high or high school) introductory set theory, or college discrete mathematics, helping students intuitively grasp graphical representations of set operations.
GeoGebra Commands & Parameters
Circle(A, 3) → cCircle(B, 3) → dIntersect(c, d) → C, D, ,Circle(A, 3) → eCircle(B, 3) → fCircleArc(A, D, C) → gCircleArc(B, C, D) → h
AI Drawing Prompt Reference
Draw a Venn diagram illustrating the union and intersection of two sets. Start with two circles of equal radius that overlap, each representing a set. Mark the intersection points of the circlescars. Use arcs to outline the overlapping region boundary. Highlight the overlapping area (intersection) and the total covered area (union) with distinct colors or shading. Add text labels near or inside the circles to name the sets and the results of union and intersection. Include auxiliary segments or marked points to clarify the set operations. Keep the layout clear for educational purposes.
The prompt above was compiled from the original drawing commands and is for reference only.