
Unequal Probability Demo
Loading the math board and drawing, please wait…
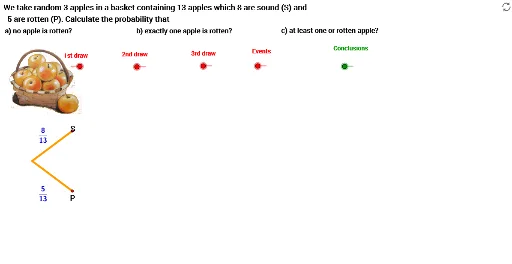
This example demonstrates how to create pie charts and linear functions with unequal probabilities using GeoGebra. It involves core math concepts like probability & statistics, linear functions, cylinders, means, and coordinate geometry. Construction highlights include commands like Point, Outil1, Vector. Suitable for high school mathematics teaching and introductory probability & statistics learning.
GeoGebra Commands & Parameters
Point(yAxis) → BOutil1(A, B) → aPoint(yAxis) → COutil1(A, C) → bOutil1(D, E) → cOutil1(F, G) → dOutil1(N, O) → hOutil1(P, Q) → iOutil1(L, M) → gOutil1(L, U) → kOutil1(F, I) → eOutil1(D, K) → fOutil1(P, H) → jOutil1(N, J) → lOutil1(R, S) → mOutil1(R, T) → nVector(V, W) → uVector(Z, A1) → vVector(B1, C1) → wVector(D1, E1) → z