
Two Graphs for Each Relationship
Loading the math board and drawing, please wait…
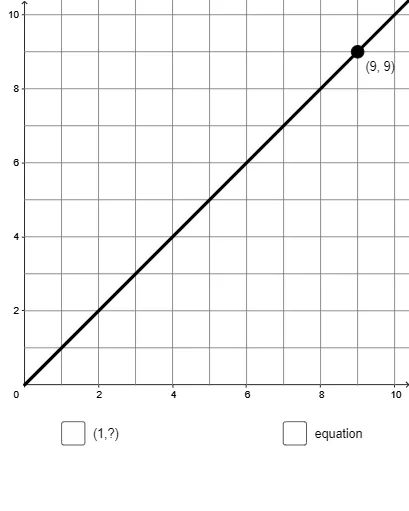
This example demonstrates two graphs for each relationship. Key math concepts include functions and graphing. Commands used include Polygon, PointIn, Ray, Sequence, Text, Segment, etc. Suitable for middle school students to learn how to graph functions.
GeoGebra Commands & Parameters
Polygon((1, 0), (12, 0), (12, 12), (1, 12)) → poly1, f, g, h, iPointIn(poly1) → ARay((0, 0), A) → jSequence(Sequence[(i + 0.075, 10.9 - j), j, 1, 10, 1], i, 1, 3, 1) → list3Sequence(Text[i, (0.25, 10.5 - i)], i, 1, 10, 1) → list1Sequence((i + 0.35, 10.4), i, 0, 2) → list5Text(x, Element[list5, 1]) → text0_1Text(y, Element[list5, 2]) → text0_2Text(y, Element[list5, 3]) → text0_3Sequence(Segment[(i, 0), (i, 12)], i, 1, 12, 1) → list6Sequence(Segment[(0, i), (12, i)], i, 1, 12, 1) → list7Sequence(Segment[(i, 0), (i, 11)], i, 0, 3.15, 1.05) → list2Sequence(Segment[(0, i), (3.15, i)], i, 0, 11, 1) → list4Sequence(Polygon[(1.6, i), (2, i), 4], i, 0.5, 9.5, 1) → list9Segment((0, 0), (0, y(A))) → kSegment((0, 0), (x(A), 0)) → lPolygon((1.85, y(A) / x(A) - 0.5), (2.45, y(A) / x(A) - 0.5), 4) → poly2Polygon((1.85, y(A) / x(A) - 1.2), (2.45, y(A) / x(A) - 1.2), 4) → poly3Polygon((x(A) + 0.65, y(A) - 0.55), (x(A) + 1.05, y(A) - 0.55), 4) → poly4Polygon((x(A) + 0.25, y(A) - 0.55), (x(A) + 0.65, y(A) - 0.55), 4) → poly5Sequence(Polygon[(1.35, i), (1.7, i), 4], i, 0.05, 9.05, 1) → list10
AI Drawing Prompt Reference
Draw a 12x12 square grid, then randomly select a point A inside the square and draw a ray from the origin to point A. Place 10 equally spaced points on the ray and draw corresponding tick marks on the x-axis and y-axis. Then draw a line segment from the origin to point A, and two slanted lines passing through point A, which intersect the x-axis and y-axis. Finally, draw a series of small rectangles inside the grid, with their vertices intersecting the slanted lines.
The prompt above was compiled from the original drawing commands and is for reference only.