
Two Fraction Bars: Visually Compare Fractions with Sliders
Loading the math board and drawing, please wait…
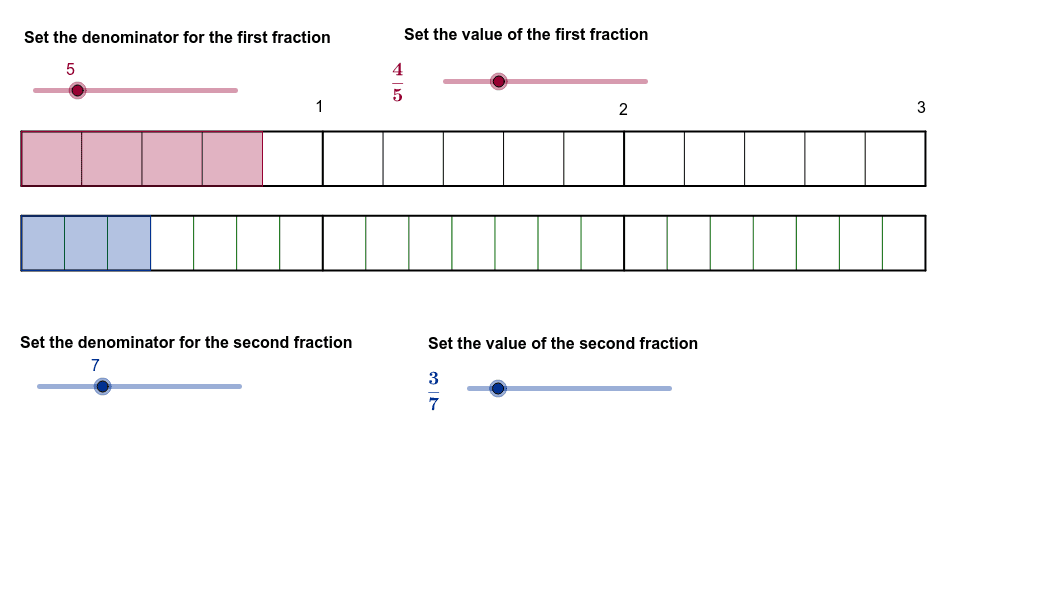
① This example demonstrates how to compare fractions visually using two adjustable fraction bars. Students set numerators and denominators via sliders, and the on-screen bars update to show the corresponding fractions, allowing direct visual comparison of their lengths. ② The core mathematical concepts include fraction meaning, comparing fractions, and equivalent fractions, involving natural numbers and fraction representation. ③ Construction highlights: The applet uses GeoGebra commands such as Segment, Dilate, OrthogonalLine, Point, Vector, Translate, Sequence, and Polygon to build the fraction bars, with sliders controlling the values and dynamically updating the visual representation. ④ It is suitable for upper elementary to middle school students learning fractions, and can be used for classroom demonstrations or self-paced exploration to build intuitive understanding of fraction size.
GeoGebra Commands & Parameters
Segment(A, B) → cDilate(A, 0.3333333333333333, B) → A'Dilate(A, 0.6666666666666666, B) → A'_1OrthogonalLine(A, c) → dPoint(d) → CPoint(d) → DVector(A, C) → uTranslate(A'_1, u) → ETranslate(A', u) → A''Translate(B, u) → B'Vector(A, D) → vTranslate(A'_1, v) → FTranslate(A', v) → A''_1Translate(B, v) → B'_1Translate(C, v) → C'Translate(E, v) → E'Translate(A'', v) → A'''Translate(B', v) → B''Segment(A, C) → eSegment(C, B') → fSegment(B', B) → gSegment(A', A'') → hSegment(E, A'_1) → iSegment(D, C') → jSegment(C', B'') → kSegment(B'', B'_1) → lSegment(B'_1, D) → mSegment(F, E') → nSegment(A''_1, A''') → pSequence(Segment[(x(A) + (w * i / d1), y(C)), (x(A) + (w * i / d1), y(A))], i, 1, (3 * d1) - 1, 1) → list1Sequence(Segment[(x(A) + (w * i / d2), y(C')), (x(A) + (w * i / d2), y(D))], i, 1, (3 * d2) - 1, 1) → list2Polygon(A, C, (x(C) + (a * w / d1), y(C)), (x(A) + (a * w / d1), y(A))) → poly1, a_1, c_1, q, rPolygon(D, C', (x(C') + (b * w / d2), y(C')), (x(D) + (b * w / d2), y(D))) → poly2, d_1, c', s, t
AI Drawing Prompt Reference
Draw two adjustable fraction bars where you can set the numerators and denominators using sliders to dynamically display the length of each fraction, allowing for visual comparison. Start by drawing two line segments to represent the fraction bars, then use scaling and translation to adjust their lengths. Finally, use polygons and line segments to shade the fraction bars.
The prompt above was compiled from the original drawing commands and is for reference only.