
Trigonometric Ratios on the Unit Circle and Their Graphs
Loading the math board and drawing, please wait…
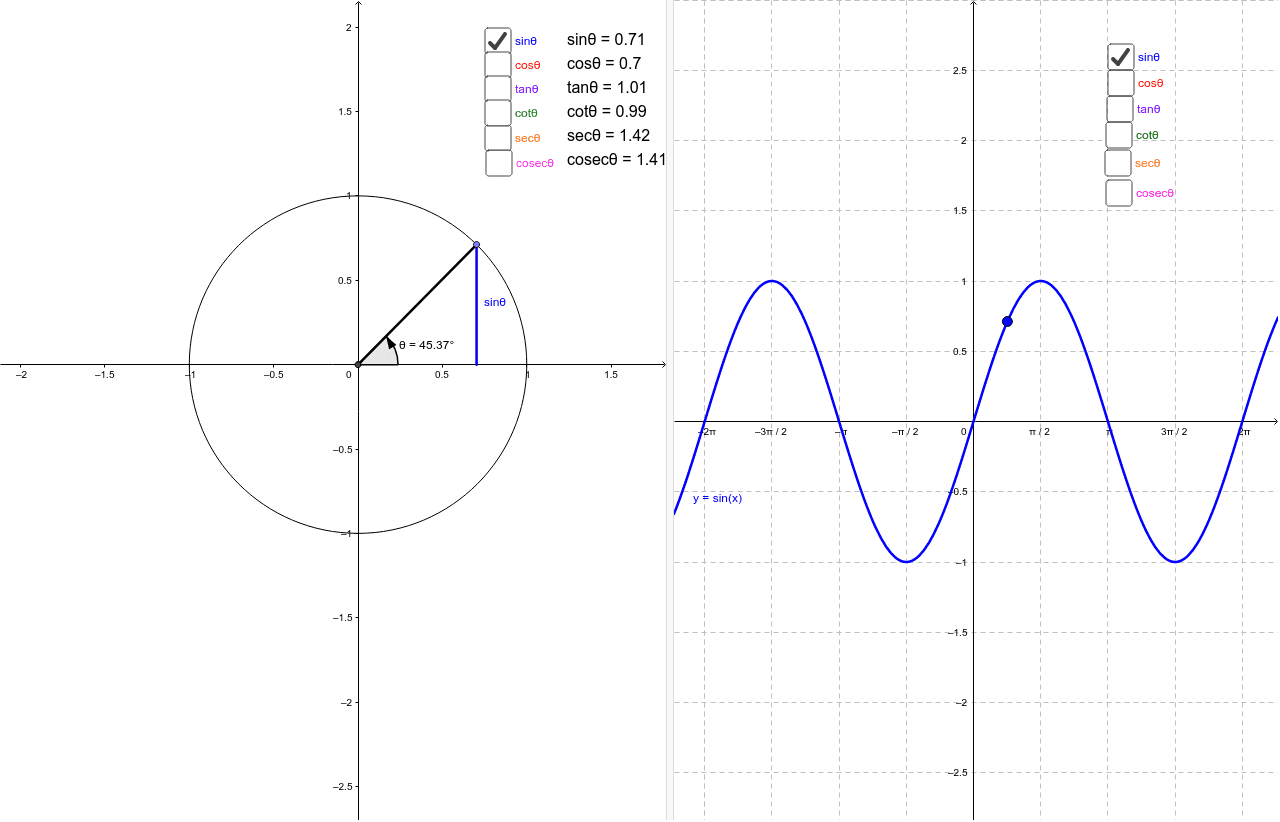
This example demonstrates the representation of sine, cosine, tangent, cotangent, secant, and cosecant on the unit circle and their corresponding graphs. By constructing objects such as circles, angles, segments, and tangents, the example provides a visual understanding of the properties of trigonometric functions. Suitable for high school mathematics education and learning.
GeoGebra Commands & Parameters
Intersect(xAxis, yAxis) → ACircle(A, 1) → cIntersect(c, xAxis, 2) → BPoint(c) → CAngle(B, A, C) → θSegment(A, C) → bSegment(D, C) → dSegment(E, C) → gIntersect(c, yAxis, 2) → FSegment(E, F) → aSegment(D, B) → hTangent(C, c) → i,Intersect(i, xAxis) → GIntersect(i, yAxis) → HSegment(C, G) → jSegment(G, A) → nSegment(C, H) → kSegment(A, H) → q
AI Drawing Prompt Reference
Draw a unit circle and mark angle θ on it, connect the center A to point C on the circle, draw the sine line b and cosine line d, then draw the tangent line g, cotangent line a, secant line h, and cosecant line j and k. Finally, draw the intersection point G of the tangent line and x-axis, the intersection point H of the tangent line and y-axis, and the line segment q from A to H.
The prompt above was compiled from the original drawing commands and is for reference only.