
Trigonometric Ratios Demonstration: Sine, Cosine, and Tangent in a Right Triangl
Loading the math board and drawing, please wait…
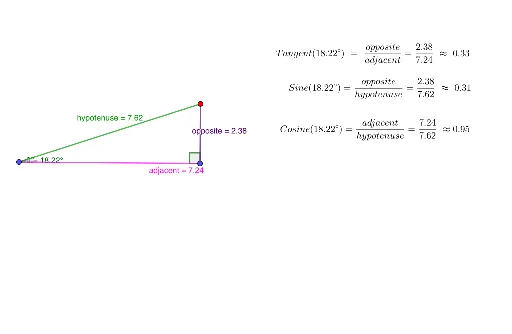
This GeoGebra example dynamically demonstrates the definitions of trigonometric ratios (sine, cosine, and tangent) using a right triangle. It visually shows how the ratios of the opposite side, adjacent side, and hypotenuse change as the acute angle varies. The construction uses GeoGebra commands such as Segment to draw the triangle sides, OrthogonalLine to ensure the right angle, Point to mark vertices, and Angle to display angles θ and β. Key objects include vertices A, B, C, sides labeled adjacent, opposite, hypotenuse, and dynamic text objects (text1, text2, text3) that display the numerical values of sine, cosine, and tangent. This resource is ideal for middle or high school students learning basic trigonometry, allowing them to drag points or use sliders to observe how ratios change, thereby reinforcing the concept that each acute angle corresponds to a unique set of trigonometric ratios.
GeoGebra Commands & Parameters
Segment(A, B) → adjacentOrthogonalLine(B, adjacent) → gPoint(g) → CSegment(A, C) → hypotenuseSegment(C, B) → oppositeAngle(B, A, C) → θAngle(C, B, A) → β