
Trigonometric Ceilings and Floors: Exploring Sine Function Parameters
Loading the math board and drawing, please wait…
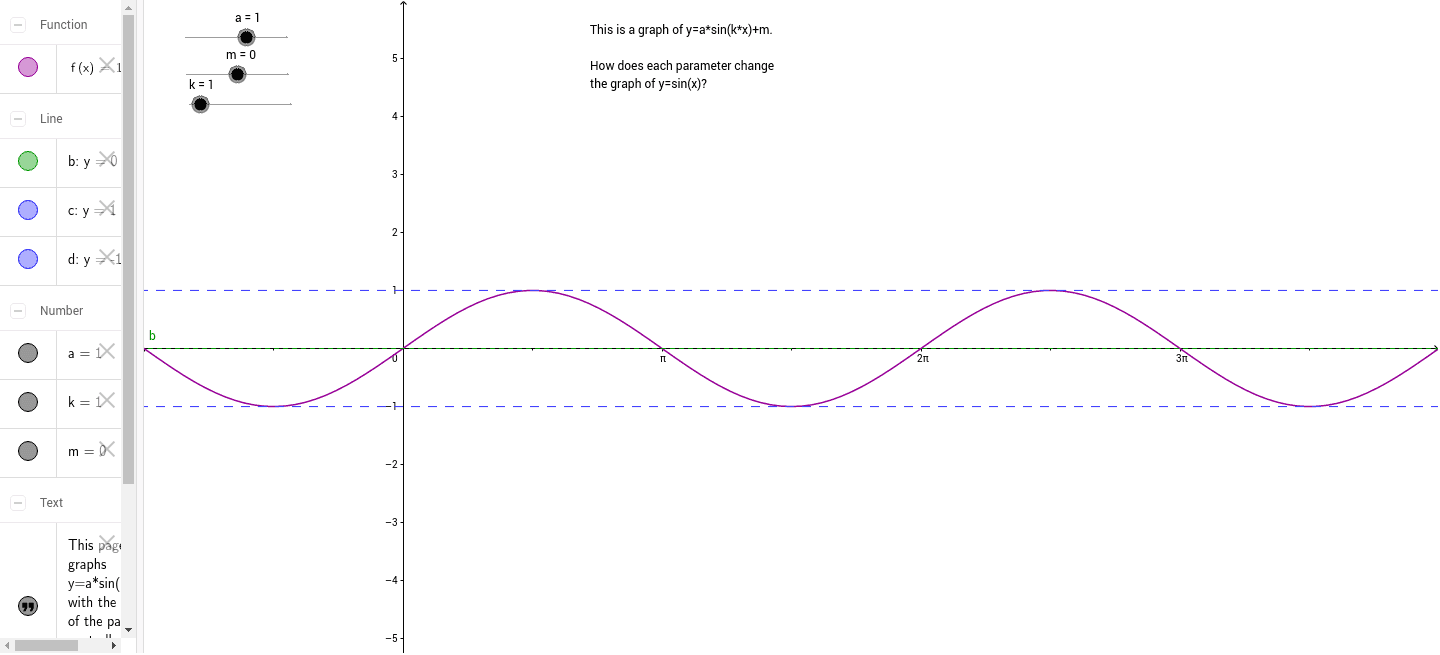
This GeoGebra example dynamically illustrates how the parameters in y = a*sin(k*x) + m affect the graph of a sine function. The midline m sets the vertical center, the amplitude a determines the distance from the midline to the maximum (ceiling) and minimum (floor) values, and the frequency parameter k controls the period. Core mathematical concepts include sinusoidal transformations, amplitude, period, vertical shift, and extrema of functions. The construction uses sliders for a, m, and k, a function object f for the sine curve, and text objects to display parameter values or explanations. It is suitable for high school or introductory college students learning trigonometric graphs, and serves as an interactive tool for teachers to demonstrate or for students to explore how changing parameters alters the wave's shape and position.
GeoGebra Commands & Parameters
Numeric a(1.0)Numeric m(0.0)y = my = m + ay = m - aNumeric k(1.0)f(x) = a * sin(k * x) + m
AI Drawing Prompt Reference
Draw a sine wave graph defined by y = a*sin(k*x) + m. Include three horizontal reference lines: the midline y = m, and the ceiling and floor lines y = m + a and y = m - a. Use three sliders to control the parameters a (amplitude), m (vertical shift), and k (frequency). As the sliders move, the sine curve updates dynamically, and the current parameter values are displayed. The graph should clearly illustrate how amplitude, period, and vertical translation affect the wave's shape and position, suitable for classroom demonstration.
The prompt above was compiled from the original drawing commands and is for reference only.