
Tree Diagram
Loading the math board and drawing, please wait…
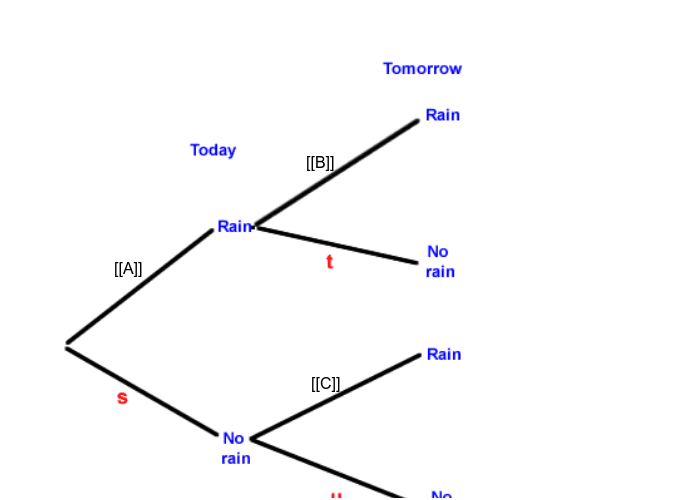
This example demonstrates the construction of a tree diagram, a graphical tool used to illustrate the probabilities of events. It involves core concepts of probability and statistics. Using GeoGebra commands such as objects, points, and images, the example clearly shows each event and its probability. Suitable for students at the junior high school level and above.
GeoGebra Commands & Parameters
Point B(0.0, 0.0)Point C(9.0, 0.0)Point A(2.0, 5.0)Point D(6.02, 7.3)Point E(6.0, 3.0)
AI Drawing Prompt Reference
Draw a tree diagram to illustrate event probabilities, featuring three points at the base forming a foundational structure, one point in the middle connecting to them, and another point extending upwards, connected by straight lines to show probability relationships clearly.
The prompt above was compiled from the original drawing commands and is for reference only.