
Translations: Vector-Based Shifting of Triangles and Logarithmic Graphs
Loading the math board and drawing, please wait…
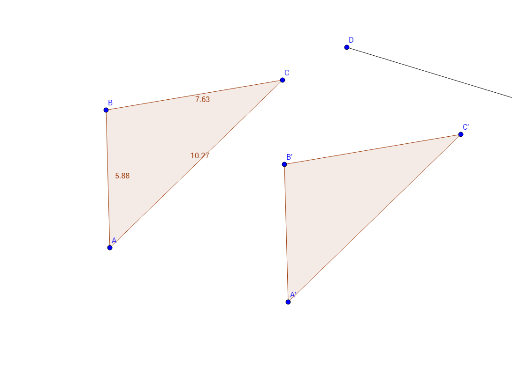
This GeoGebra example demonstrates how a triangle, its circumcircle, and a logarithmic function graph are translated by a given vector, visually showing that translation preserves shape and size. The core mathematical concepts include translation as a similarity transformation, vectors, polygons, circles, logarithmic functions, and right triangles. Construction highlights: the Polygon command creates triangle poly1, the Vector command defines translation vector u, and the Translate command shifts the triangle, circle, and function graphs to produce images poly1', c', a', and b'. The Distance command measures distances between corresponding points to verify the isometric property. This resource is suitable for middle and high school students learning geometric transformations, vectors, and function graph shifts, and for teachers demonstrating the coordinate changes underlying translation.
GeoGebra Commands & Parameters
Polygon(A, B, C) → poly1, c, a, bVector(D, E) → uTranslate(A, u) → A'Translate(B, u) → B'Translate(C, u) → C'Polygon(A', B', C') → poly1', c', a', b'Distance(a, c) → d
AI Drawing Prompt Reference
Draw a triangle with its circumcircle and a logarithmic curve. Apply a translation vector to shift the triangle's vertices, the circumcircle, and the logarithmic curve together, producing translated versions of each. Use dashed lines or different colors to distinguish original and translated figures, and mark distances between corresponding points to show that translation preserves shape and size.
The prompt above was compiled from the original drawing commands and is for reference only.