
Transforming sin(x) to |sin(x²/4)|: Function Graph Animation
Loading the math board and drawing, please wait…
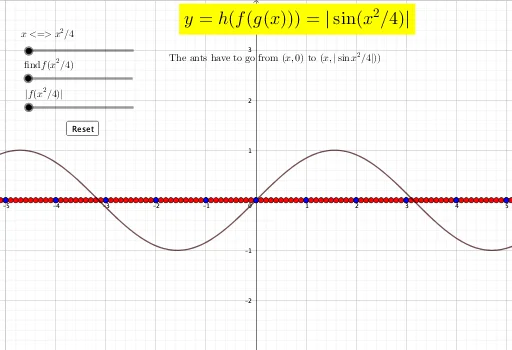
This GeoGebra example demonstrates the dynamic transformation of the basic trigonometric graph y = sin(x) into the composite absolute-value function y = |sin(x²/4)|, illustrating how variable substitution, function composition, and absolute value operations reshape the curve. Core mathematical concepts include function graph transformation, trigonometric functions, composite functions, absolute value functions, and coordinate-plane graphing. The construction relies on GeoGebra commands Sequence and CurveCartesian to generate parameter sequences and draw parametric curves, involving objects such as function f, parameters k, n, d, v, button button1, text objects text1 and text6_1, axis bounds xl, xr, yt, yb, and points X, Z, q, Q, S, h. It is suitable for high school mathematics teaching on functions and trigonometry, and for introductory university calculus or precalculus courses as a visual tool for exploring graph transformations and interactive classroom inquiry.
GeoGebra Commands & Parameters
Sequence(-6 + (0.1 * i), i, 0, 120) → XSequence(i, i, -6, 6) → ZCurveCartesian(((1 - u) * t) + (u * t^(2) / 4), (((1 - q) * k) * f(t^(2) / 4)) + (q * abs((k * f(t^(2) / 4)))), t, -6, 6) → h
AI Drawing Prompt Reference
Create an animated graph showing the smooth transformation from a basic sine curve to the absolute value of a composite function. Start with the sine wave over the interval from negative six to positive six. Then, as parameters change, the x-coordinate gradually becomes the square of the variable divided by four, while the y-coordinate undergoes scaling and absolute value operations, resulting in a symmetric wave pattern. Include coordinate axes, an animation control button, and text labels for key points. The graph should display a continuous transition, suitable for teaching function transformations.
The prompt above was compiled from the original drawing commands and is for reference only.