
Transformations of Quadratic Functions
Loading the math board and drawing, please wait…
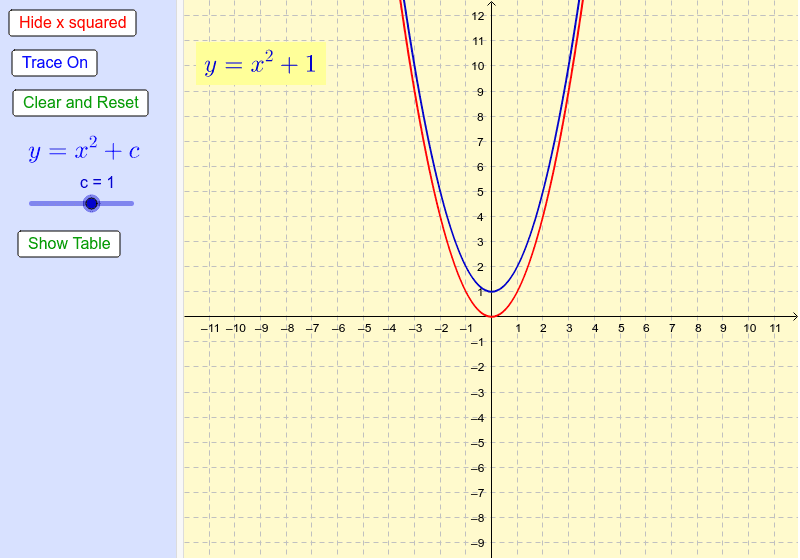
This example demonstrates the effect of changing the value of c in a quadratic equation. By comparing the graph and the table of values, you can observe the changes in the quadratic function's graph. The TableText command is used to display the table data, and a slider animation is employed to dynamically change the value of c. Suitable for students in middle school and above to learn about the properties and transformations of quadratic functions.
GeoGebra Commands & Parameters
TableText({{A1, B1, C1}, {A2, B2, C2}, {A3, B3, C3}, {A4, B4, C4}, {A5, B5, C5}, {A6, B6, C6}, {A7, B7, C7}, {A8, B8, C8}}, "|_") → text2
AI Drawing Prompt Reference
Create a dynamic graph showing a quadratic function whose constant term can be adjusted with a slider. Display a parabola that shifts vertically as the constant changes, alongside a table of values with columns separated by vertical lines. The table lists input-output pairs that update in sync with the parabola, illustrating how the graph transforms. Keep the layout clean and educational, suitable for classroom demonstration.
The prompt above was compiled from the original drawing commands and is for reference only.