
Transformations of Logarithmic Functions
Loading the math board and drawing, please wait…
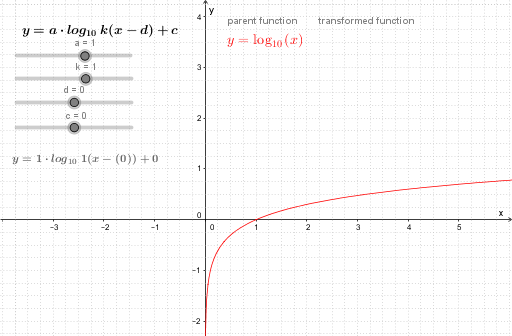
This example demonstrates transformations of logarithmic functions. It covers the basic properties and graphical transformations of logarithmic functions. By adjusting parameters, you can observe the translation and scaling changes in the logarithmic function graph. The GeoGebra commands used in the construction include objects k, a, translabel, standard, d, c, origlabel, original, transformed, trans, orig, and subbed. Suitable for high school math education and learning.
GeoGebra Commands & Parameters
Numeric k(1.0)Numeric a(1.0)Numeric d(0.0)Numeric c(0.0)original(x) = lg(x)transformed(x) = (a * lg((k * (x - d)))) + c
AI Drawing Prompt Reference
Draw a logarithmic function graph and its transformations. Start with the basic logarithmic curve passing through (1,0) and extending upward to the right. Then show a transformed version by applying horizontal and vertical shifts, as well as horizontal and vertical scaling. Display both the original and transformed curves in different colors or line styles, with labels indicating the transformation parameters. The graph should clearly illustrate how the curve changes with each parameter adjustment.
The prompt above was compiled from the original drawing commands and is for reference only.